Download The

CT TECHNOLOGY BENEFITS & IMI
TREATMENT RESULTS SUMMARY
- Pacific Seeds is the only company in the World currently to have developed and released CT Technology dual herbicide stacked technology
- CT stacked technology is set to take over from straight Triazine technology as they are demonstrating competitive yields and more flexibility.
- CT Technology will be more popular also due to significant increases in area across Australia being sown into IMI Tolerant Wheat, Barley, Lentils, Beans and Oats.
- CT Technology is aimed at both Improving weed control options in IWM programs and providing vital crop protection for growers from IMI soil residual carryover
- Current CT hybrids are adapted between 1t/ha right through to 3.5t/ha yield growing environments; Hyola Enforcer CT and Hyola 580CT.
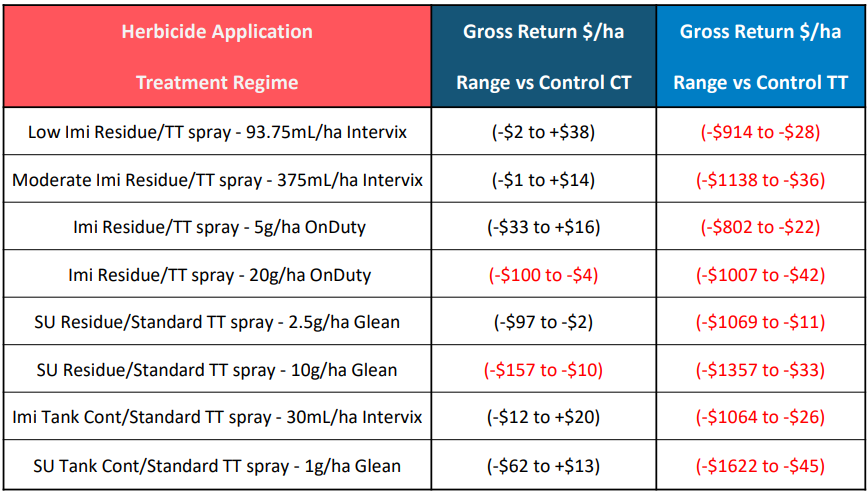
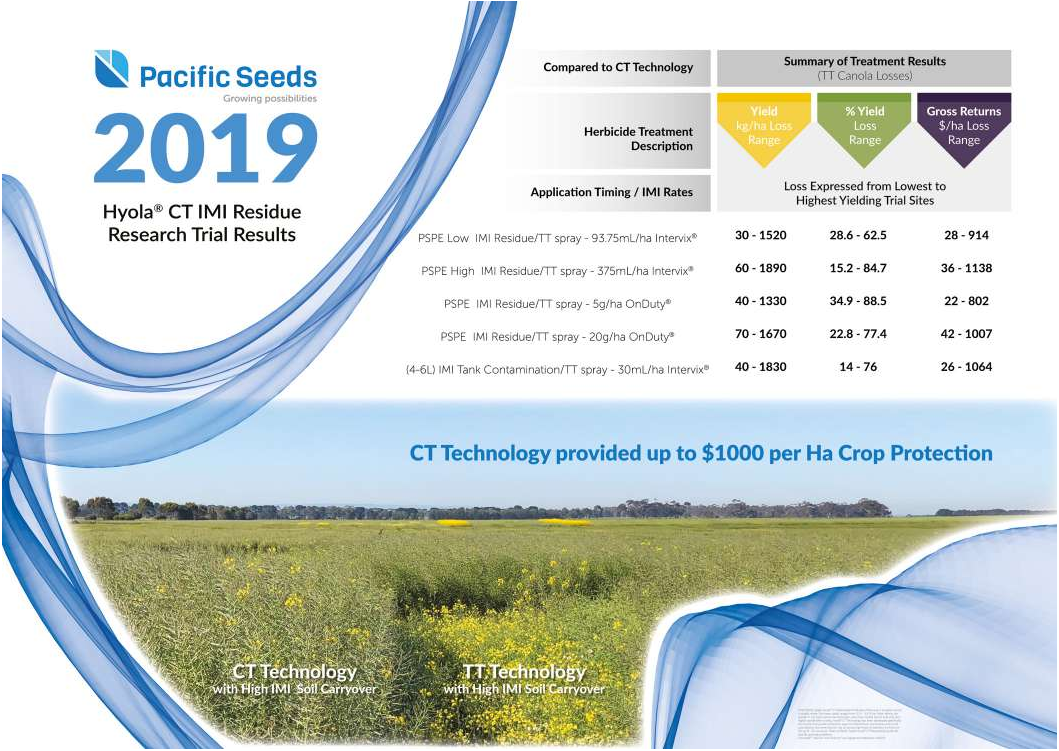
- In 2019, CT IMI replicated residue trials showed up to $1000/ha protection value using PSPE IMI or SU timings as simulated treatments.
- Boom spray contamination with low levels of IMI or SU showed up to $1500/ha protection value from using CT technology over TT technology.
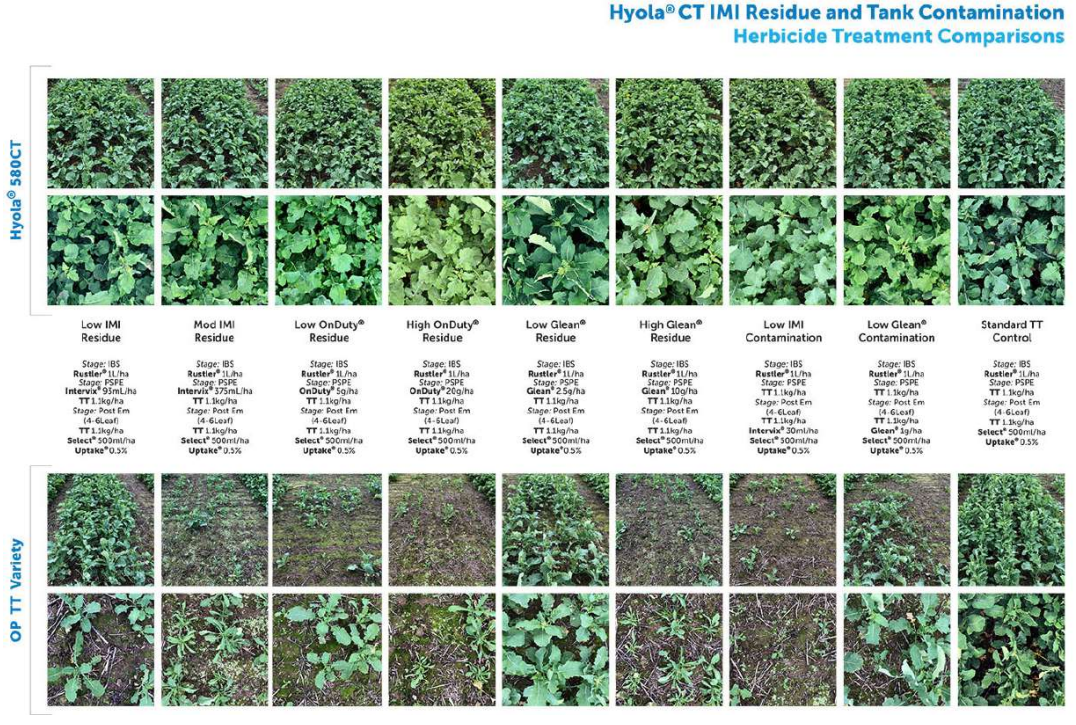
GROUP B IMI & SU TREATMENT COMPARISONS
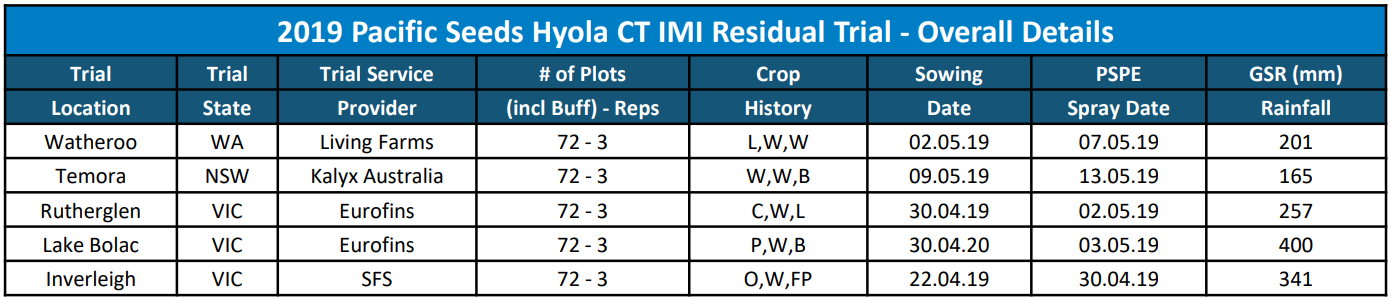
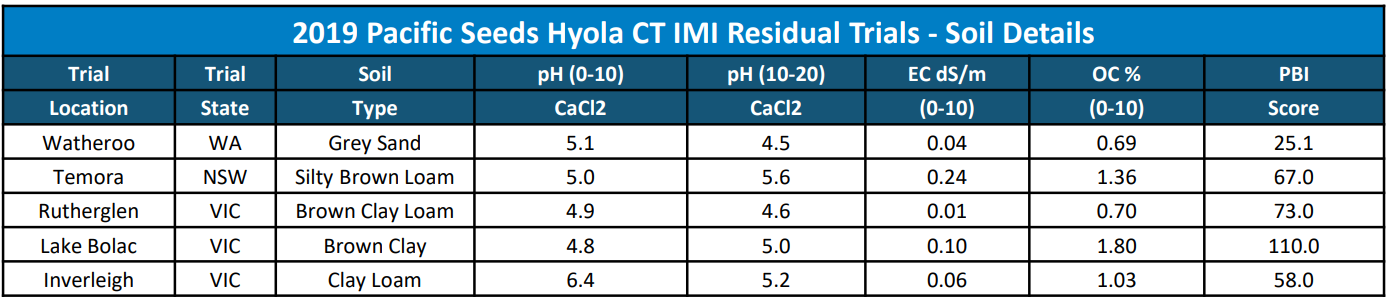
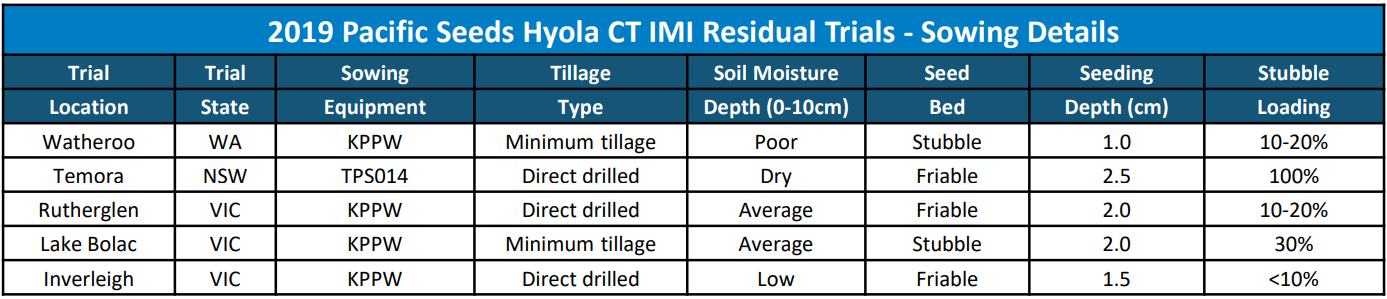
AGRONOMIC DETAILS
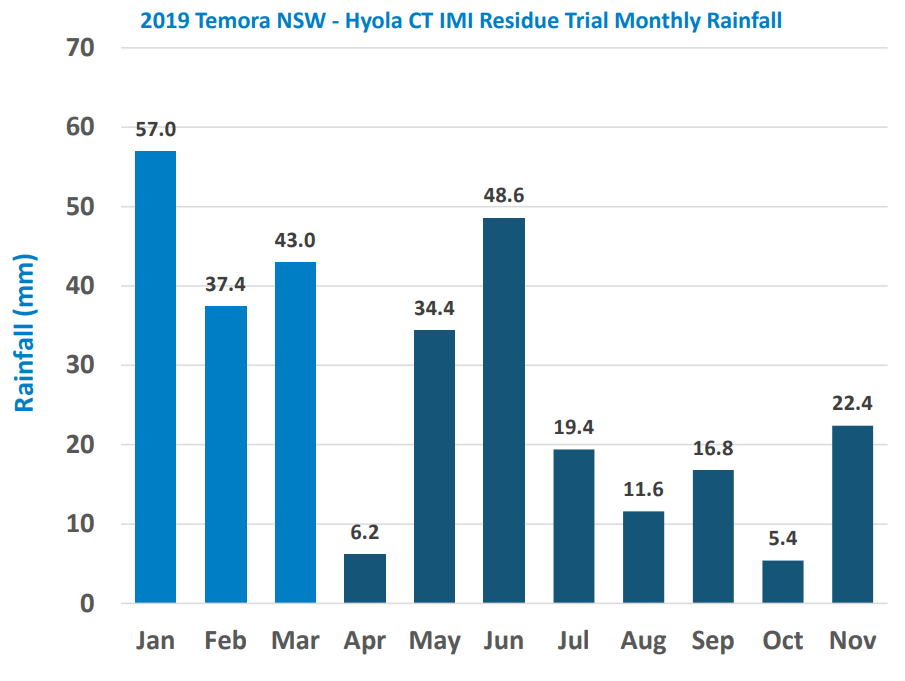
RAINFALL DISTRIBUTION DETAILS
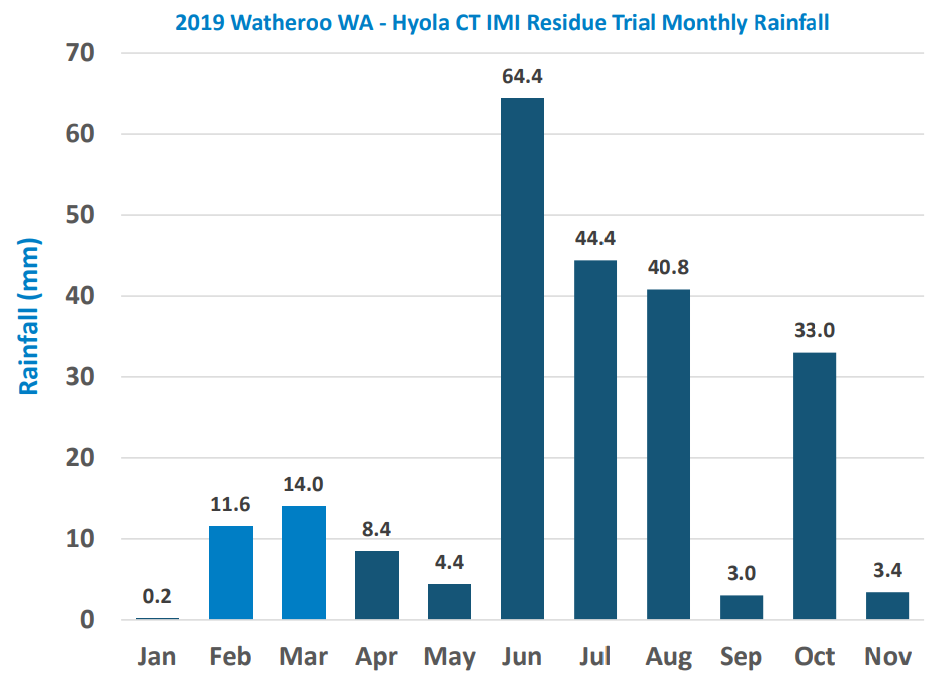
RAINFALL DISTRIBUTION DETAILS
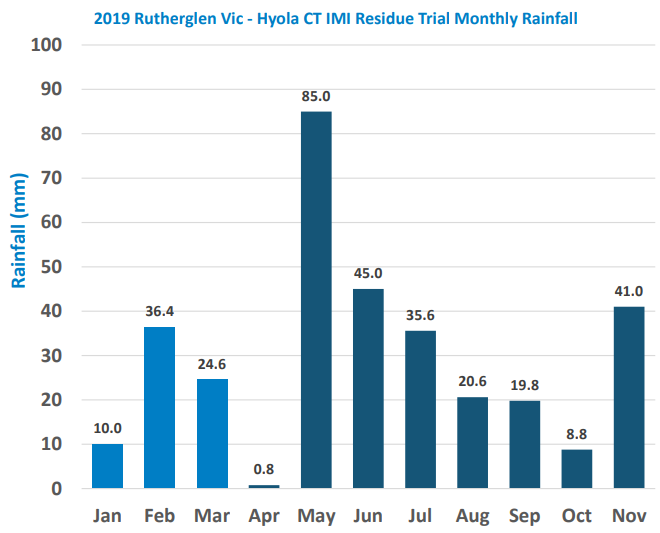
RAINFALL DISTRIBUTION DETAILS
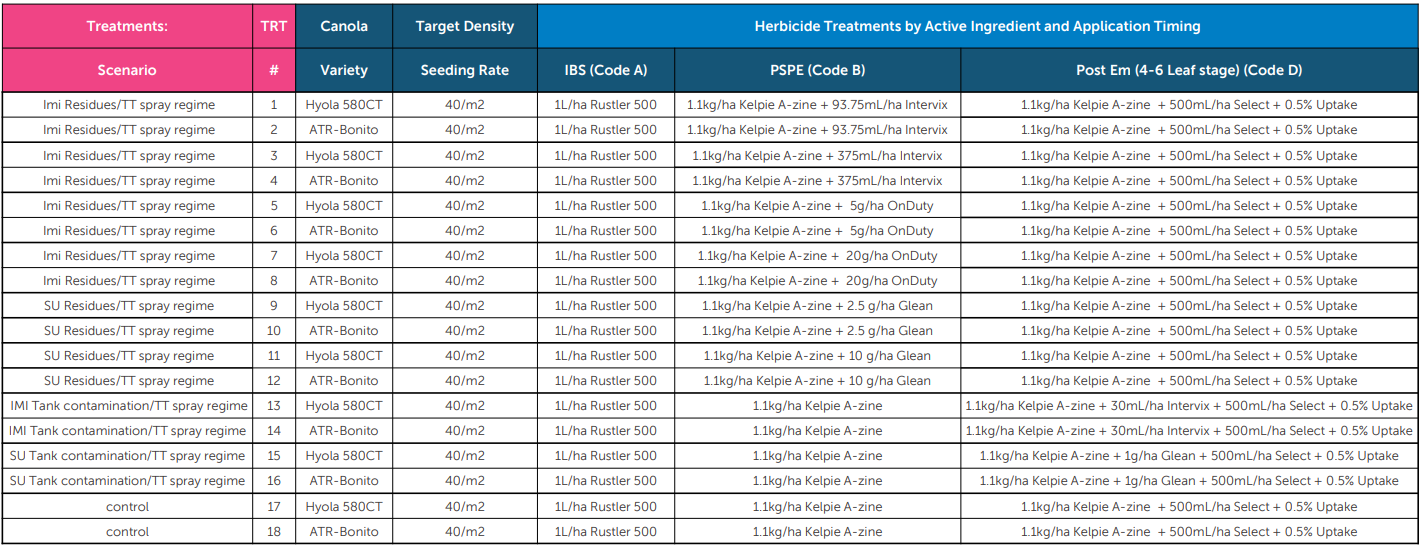
TREATMENT LISTING
ALS INHIBITORS
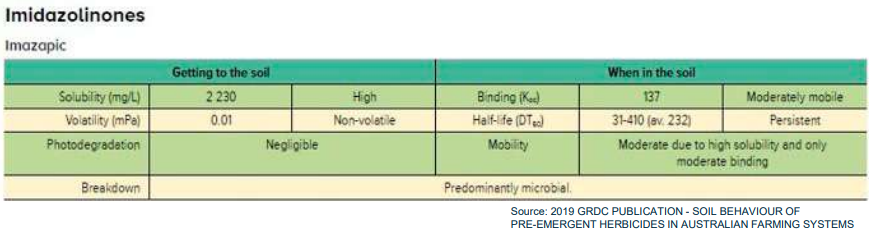
Imidazolinones (imazapic)
Practical Considerations:
- With volatility and photodegradation both being low, the herbicide will not breakdown rapidly on the soil surface after application.
- High solubility and only moderate binding allows for the herbicide to be readily washed off stubble and incorporated with rainfall.
- Moderate binding prevents excessive losses via leaching. Binding increases at lower soil pH.
- Very Persistent due to slow microbial breakdown, especially under conditions of low soil pH and low soil moisture. Substantial plantback constraints exist. Observe label constraints for pH, time and rainfall requirements.
ALS INHIBITORS
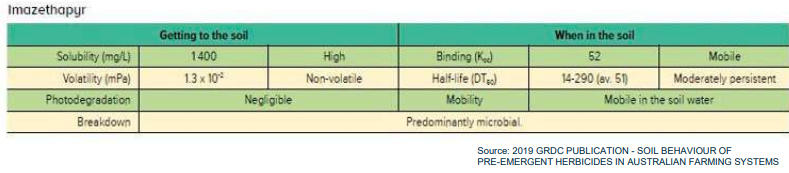
Imazethapyr
Practical Considerations:
- With volatility and photodegradation both being low, the herbicide will not breakdown rapidly on the soil surface after application.
- Imazethapyr has post-emergent and pre-emergent activity. Once in the plant it is readily translocated.
- Low binding in neutral and alkaline soils means the herbicide is likely to be freely available in soils with higher organic matter and soils where pH is below 6.5
- Persistence is moderate, however it can be quite long under conditions of low soil pH and low soil mixture, where binding increases and microbial activity is reduced. Substantial plantback constraints for pH, time and rainfall requirements.
- Crop Selectively comes from rapid metabolism in tolerant plants.
ALS INHIBITORS
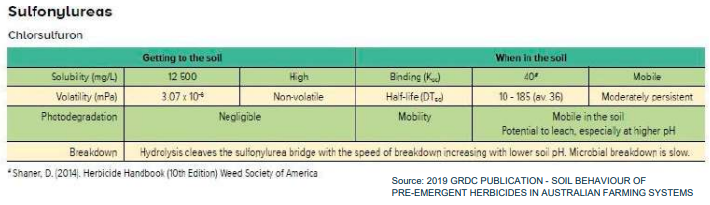
Sulfonylureas (chlorsulfuron)
Practical Considerations:
- With volatility and photodegradation both being low, the herbicide will not breakdown rapidly on the soil surface after application.
- Solubility is high and binding to organic matter is low, assissting rainfall to wash herbicide of the stubble.
- Speed of breakdown depends on soil pH and moisture content. Plantback to sensitive crops can be very long in alkaline soils especially under dry summer conditions. Observe label constraints for time and rainfall.
- This also means the compound is freely available for root uptake and translocation once in the soil however there is potential for leaching down the profile following large rainfall events, particularly in alkaline soils. If applied to dry soil without mechanical incorporation and followed by a significant rainfall event during emergence, there is potential for it to move down the profile and damage germinating crops.
SITE HERBICIDE BEHAVIOUR SUMMARY
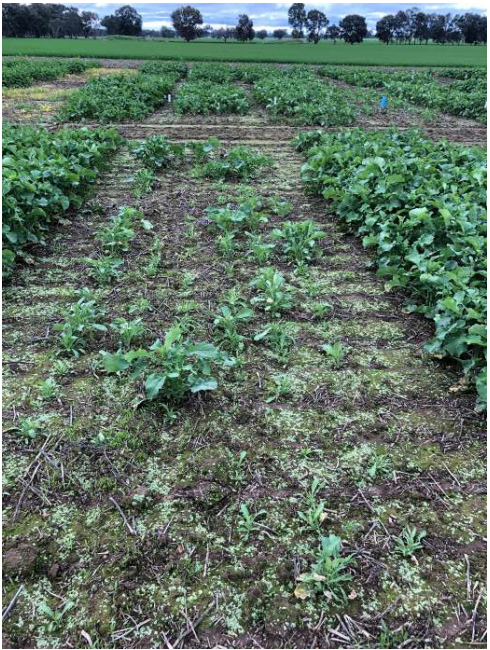
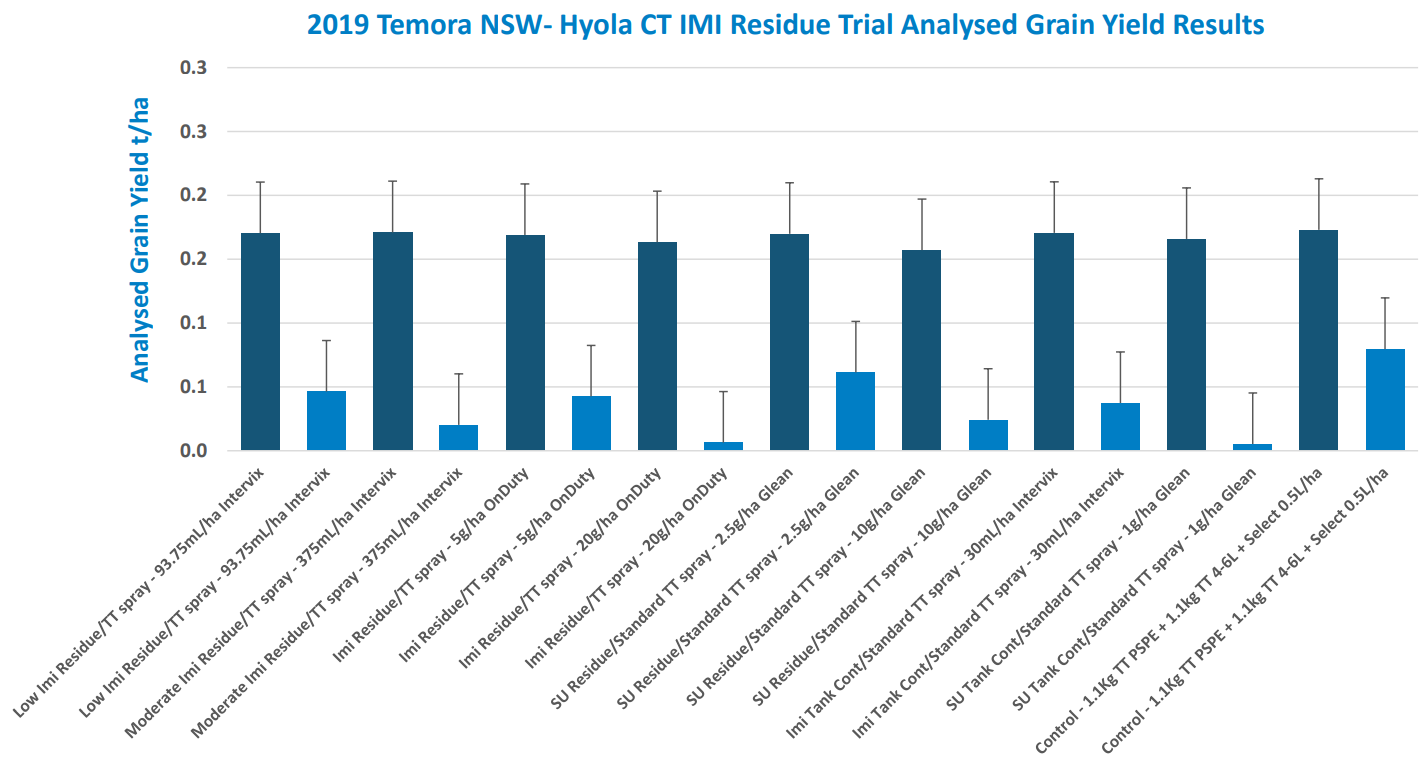
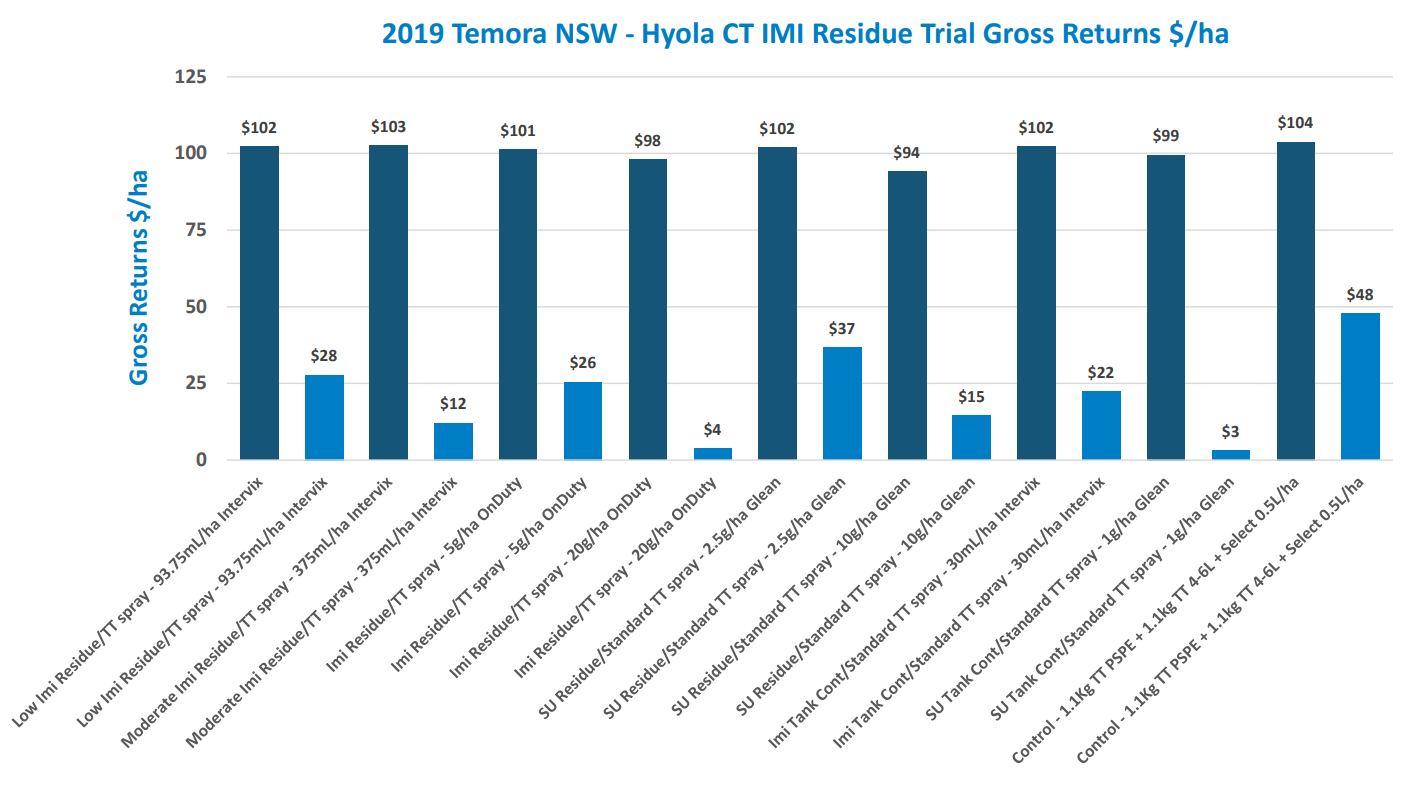
2019 Temora NSW
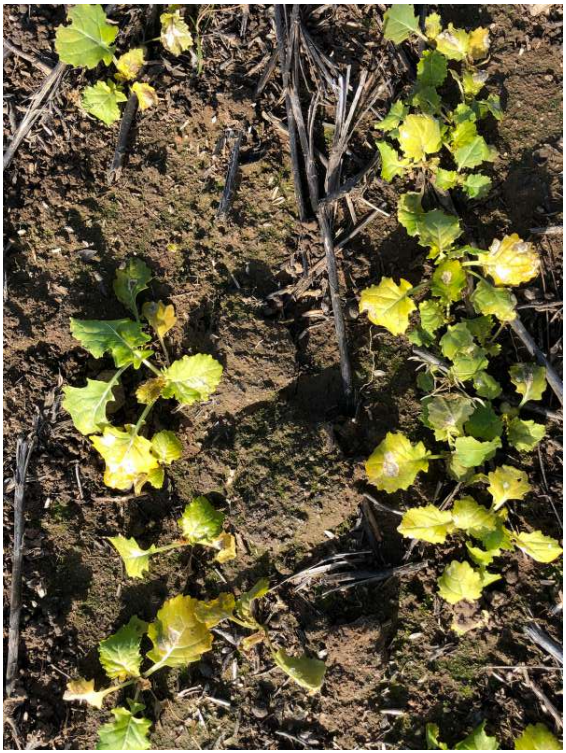
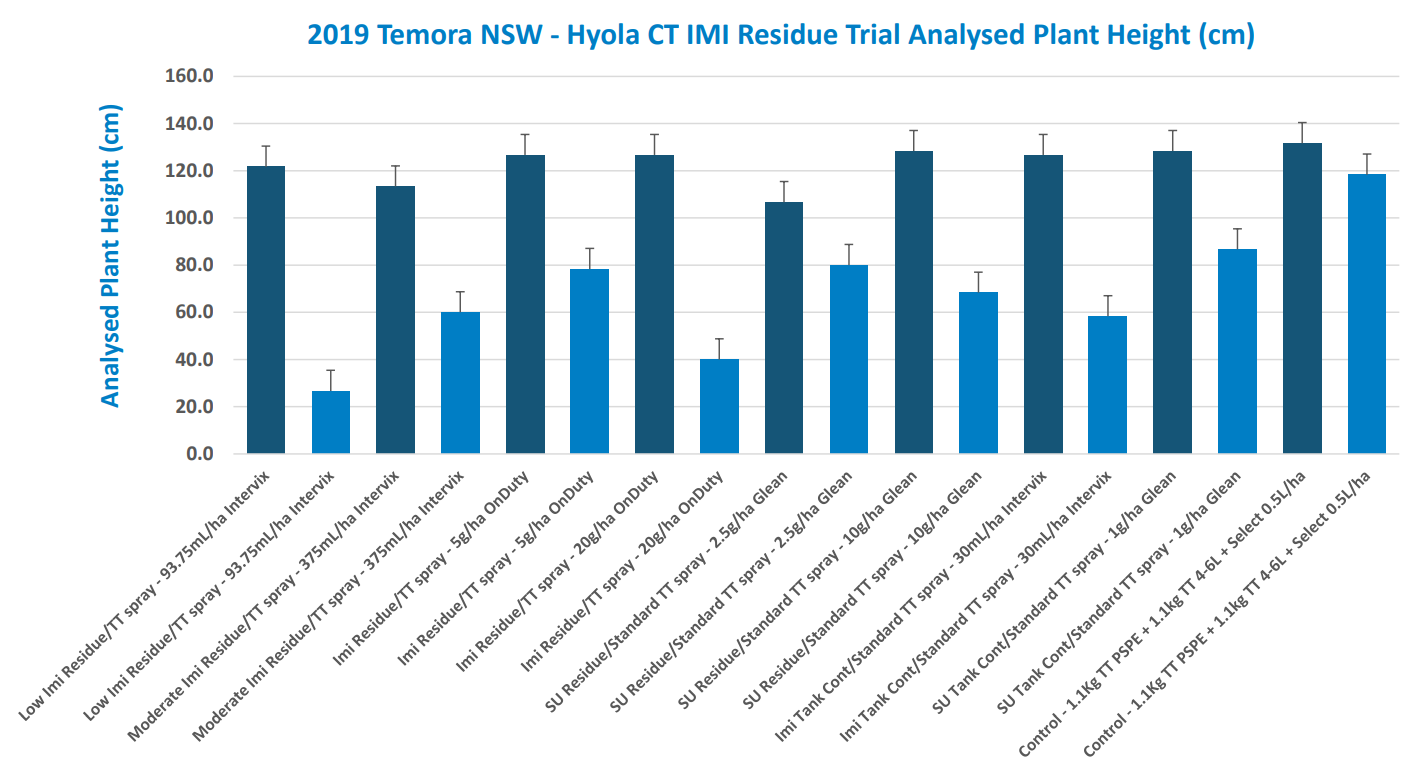
Minimal establishment effects mainly due to soil having even dry profile establishment conditions and pH related IMI & SU movement into a zone ‘slightly’ below the roots of the young seedlings. The canola was impeded initially by ongoing dry conditions and frosts which didn’t allowplants to find either water or IMI residue below the roots of the young seedlings until later in the season (July to Sept) but symptoms were somewhat variable because it was more alkaline at depth which changes the movement pattern of different chemistries.
Acid topsoil may have led to faster Glean® breakdown where as not the case of IMI chemistry. Channels of IMI chemistry in the profile after minimal movement maximised the damage effect expected on the OP TTtechnology with PSE application timing. The canola roots did make it into the chemical zone eventually and then treatment damage occurred, very often to significant levels.
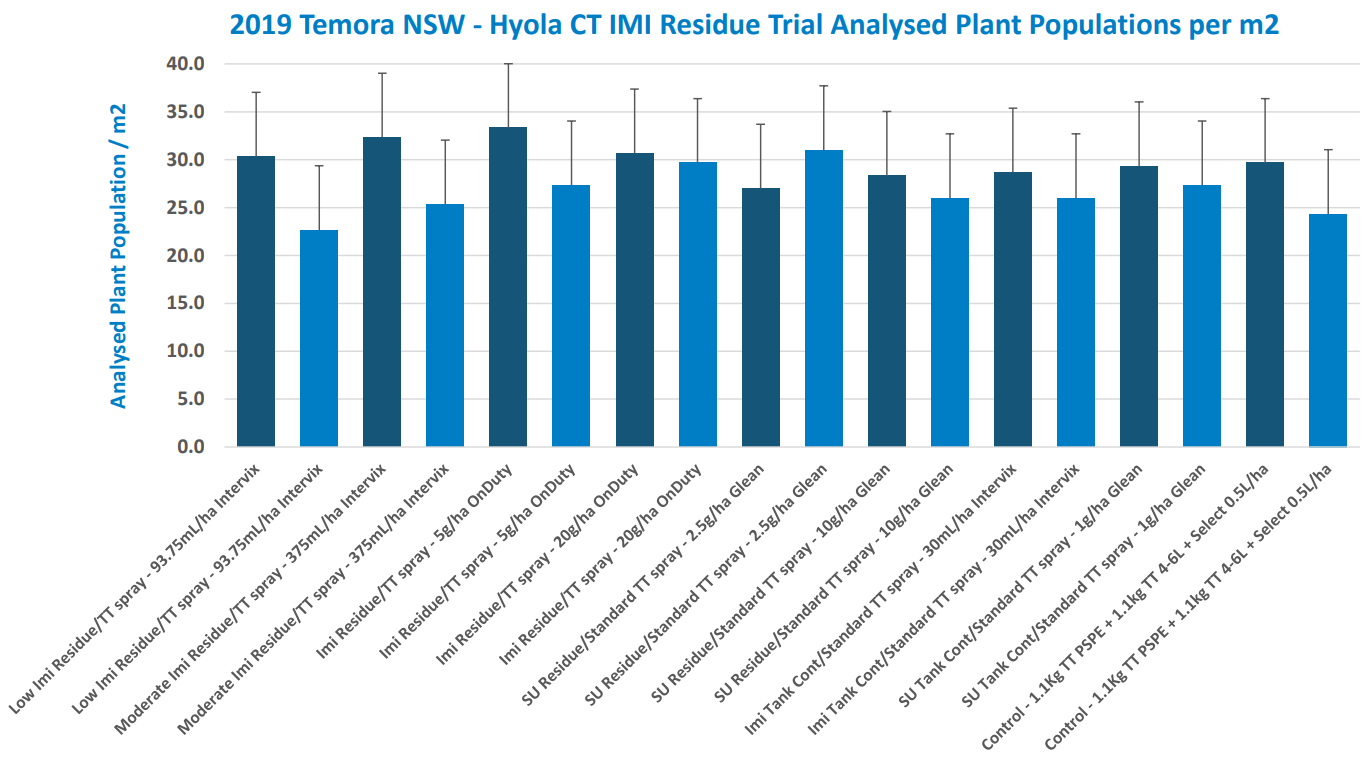
Variations in solubility have effected the IMI chemistry breakdown (less movement for OnDuty® chemistry). 1g of Glean® tank-mix and 30ml Intervix® tank-mix contamination treatments over the top has significantly impacted plant growth and yield in the OP TT variety with no inbuilt CL protection.
The CT dual stack technology has shown very good resilience to Intervix® and OnDuty®, as well as good tolerance to SU chemistry residue in this low yielding site. The OP TT had significantly lower yields with highrates of Intervix® and OnDuty® as well as the high rate of Glean®applied PSPE.
SITE HERBICIDE BEHAVIOUR SUMMARY
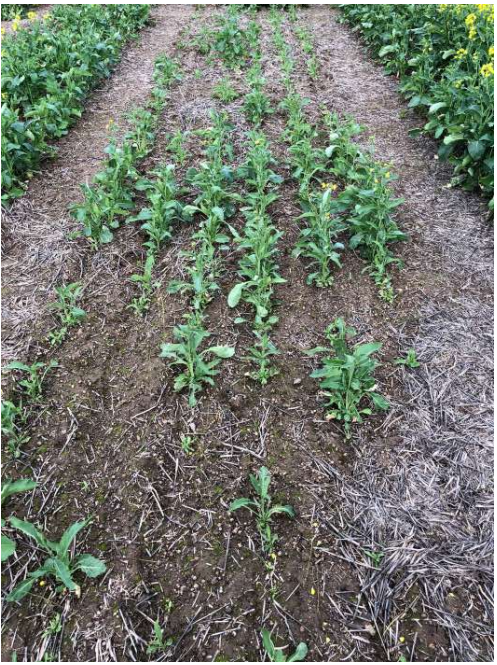
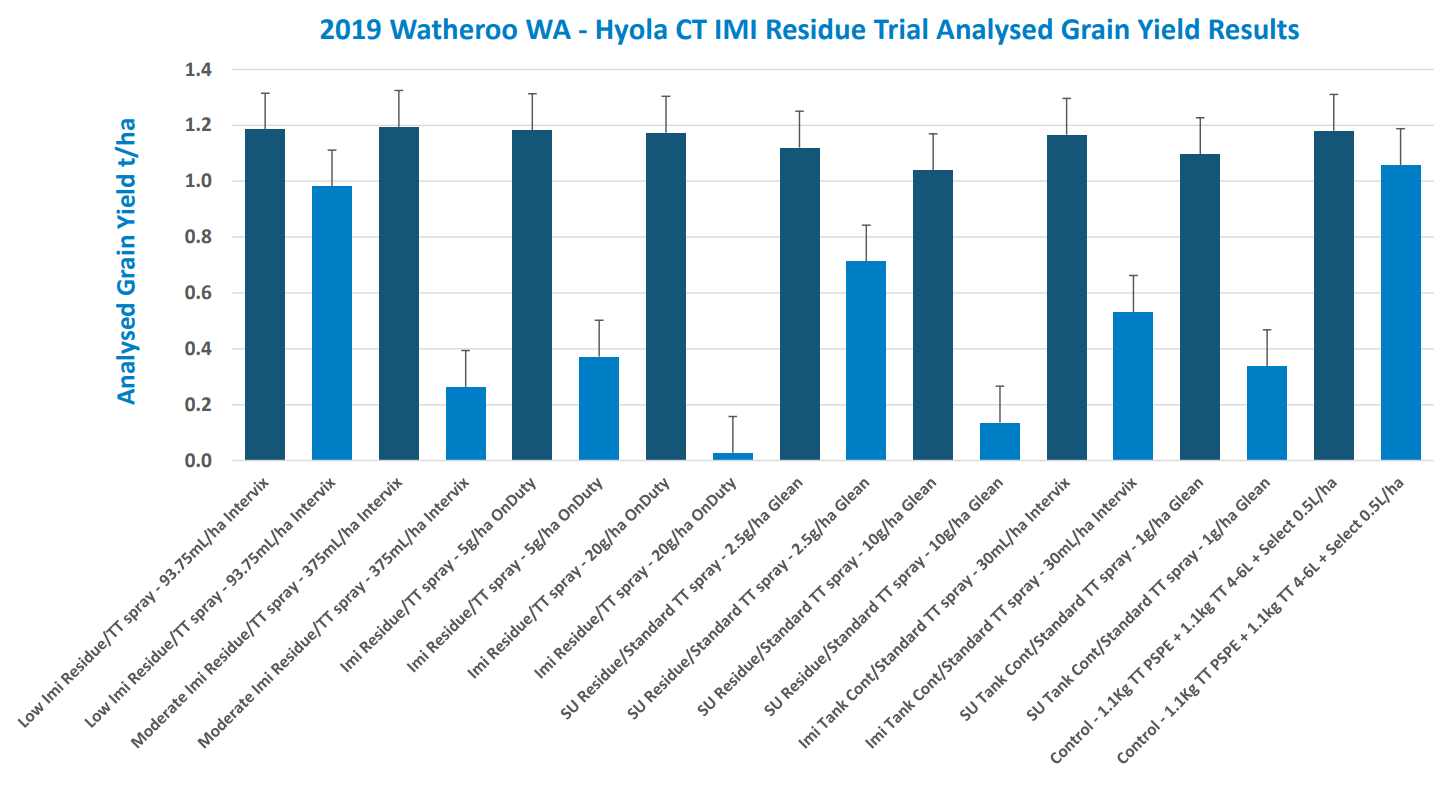
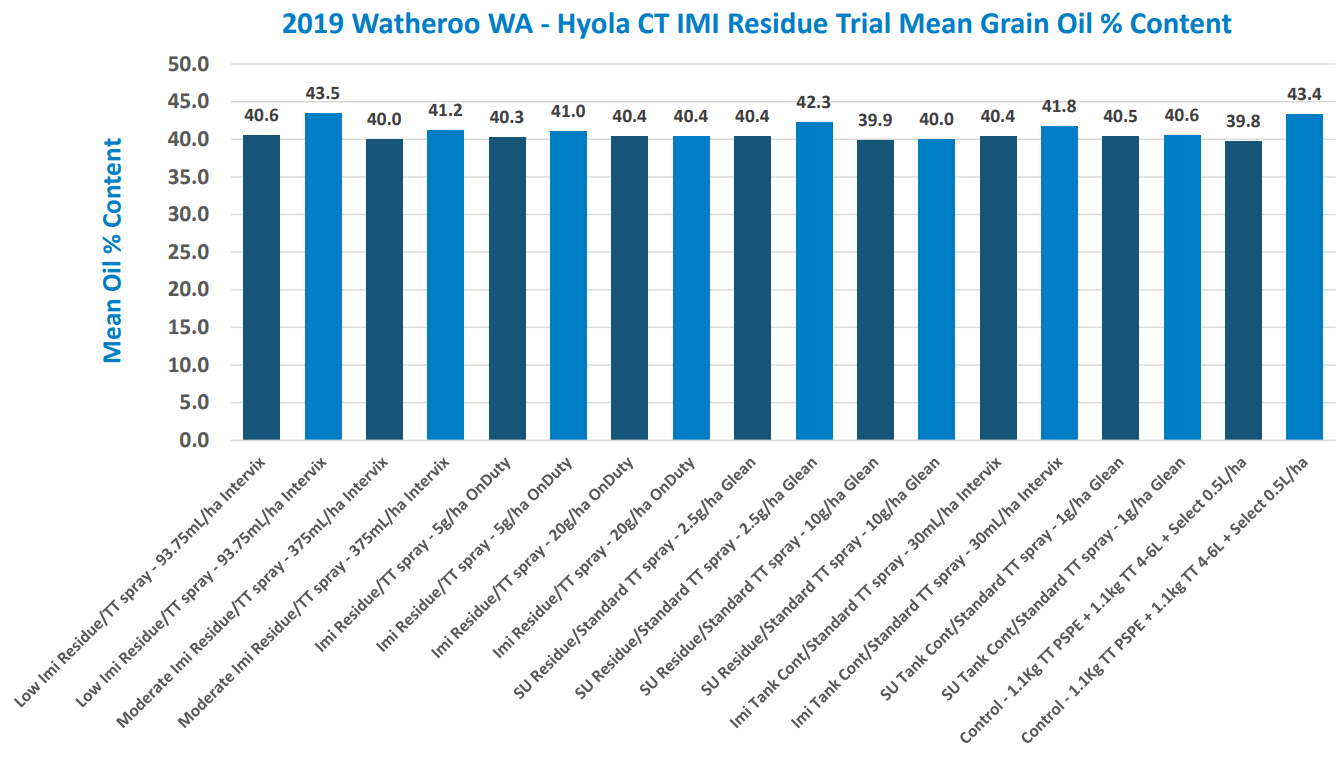
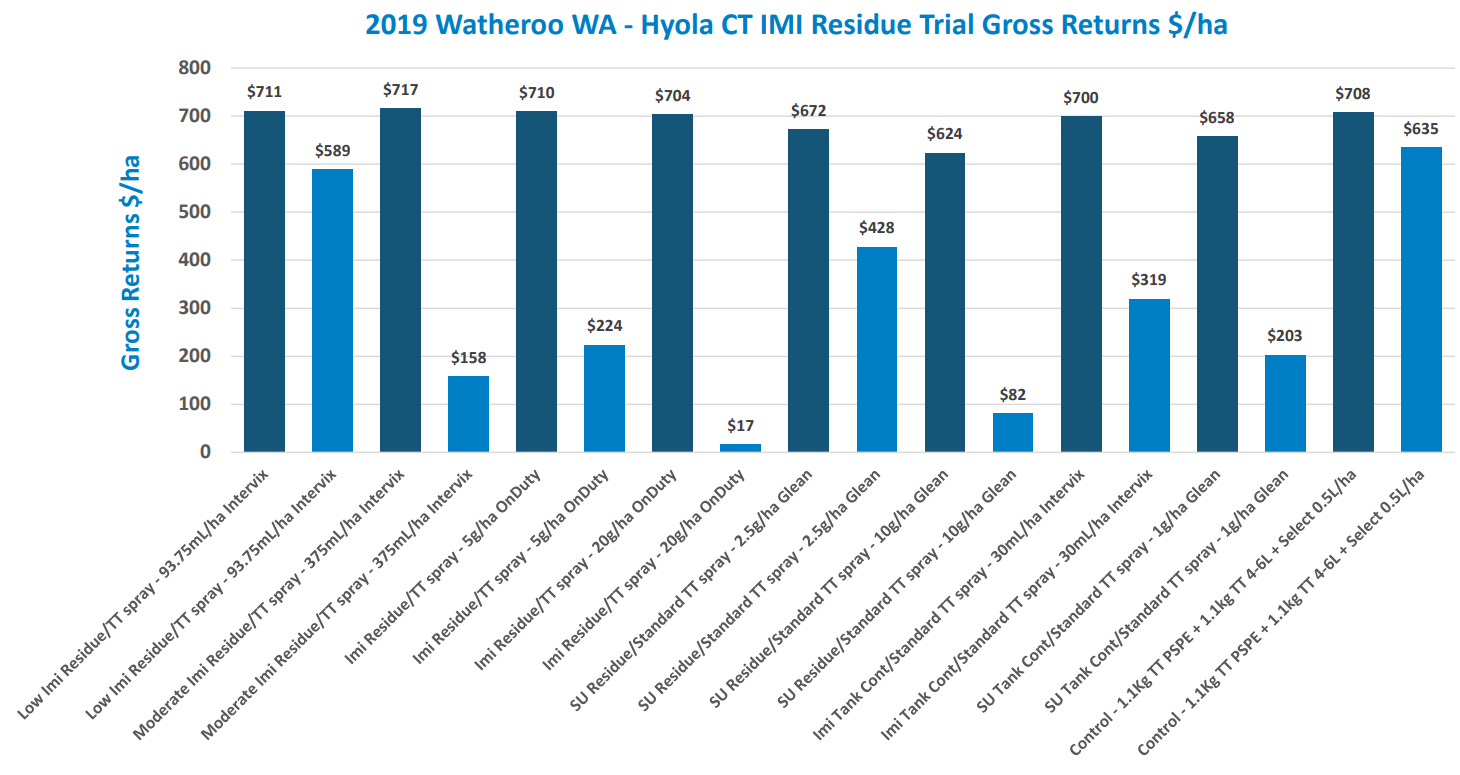
2019 Watheroo WA
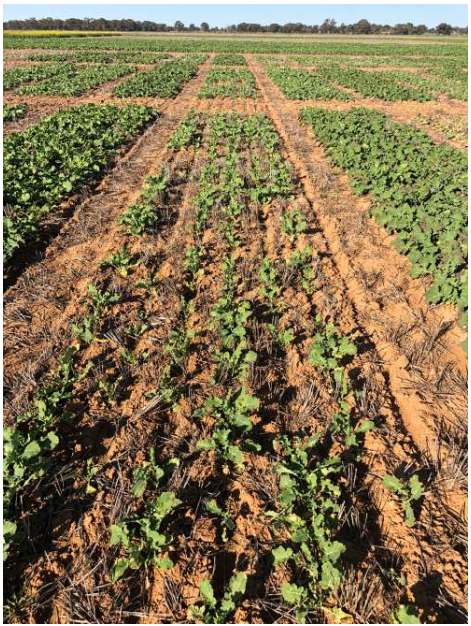
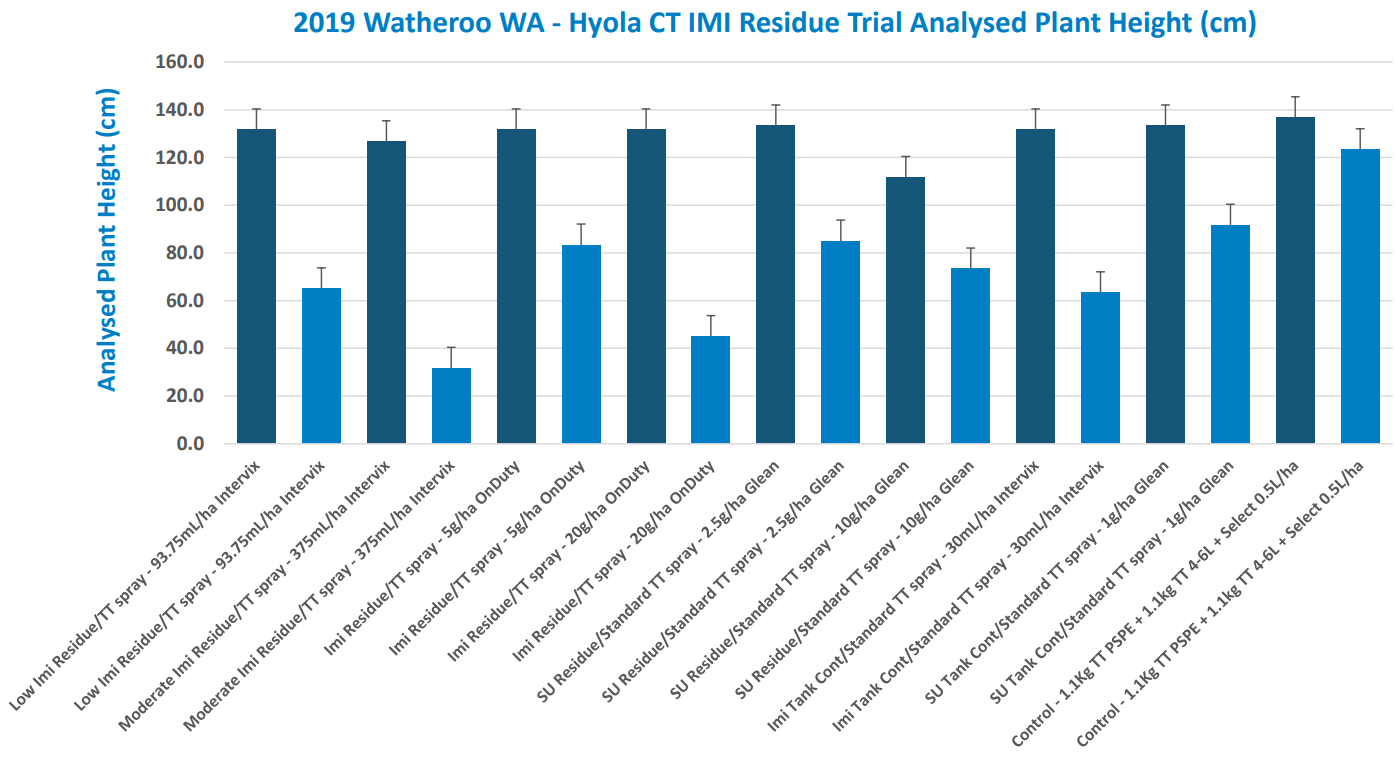
Varied establishment effects were mainly due to drier establishment conditions in May and pH related IMI & SU movement into azone within the roots of the young seedlings. The canola plants were impeded initially by dry conditions and then by specific treatments mainly being PSPE applied high rates of OnDuty® as well as low and high rates of Glean®.
Acid soils both in the top 10cm and in the 10-20cm depth have led to faster Glean® breakdown where as not the case of IMI chemistry. Reasonable amounts of IMI remained in the root profile especially with the higher rates of both Intervix® and OnDuty® where the damage to yield was significant.
When the plants were older symptoms developed quite effectively with some treatments and because there was more acid at depth, changes to the movement pattern of different chemistries would have occurred. Roots did make it into the chemical zone relatively early in the crop growth and then crop damage occurred to varying levels depending on treatment.
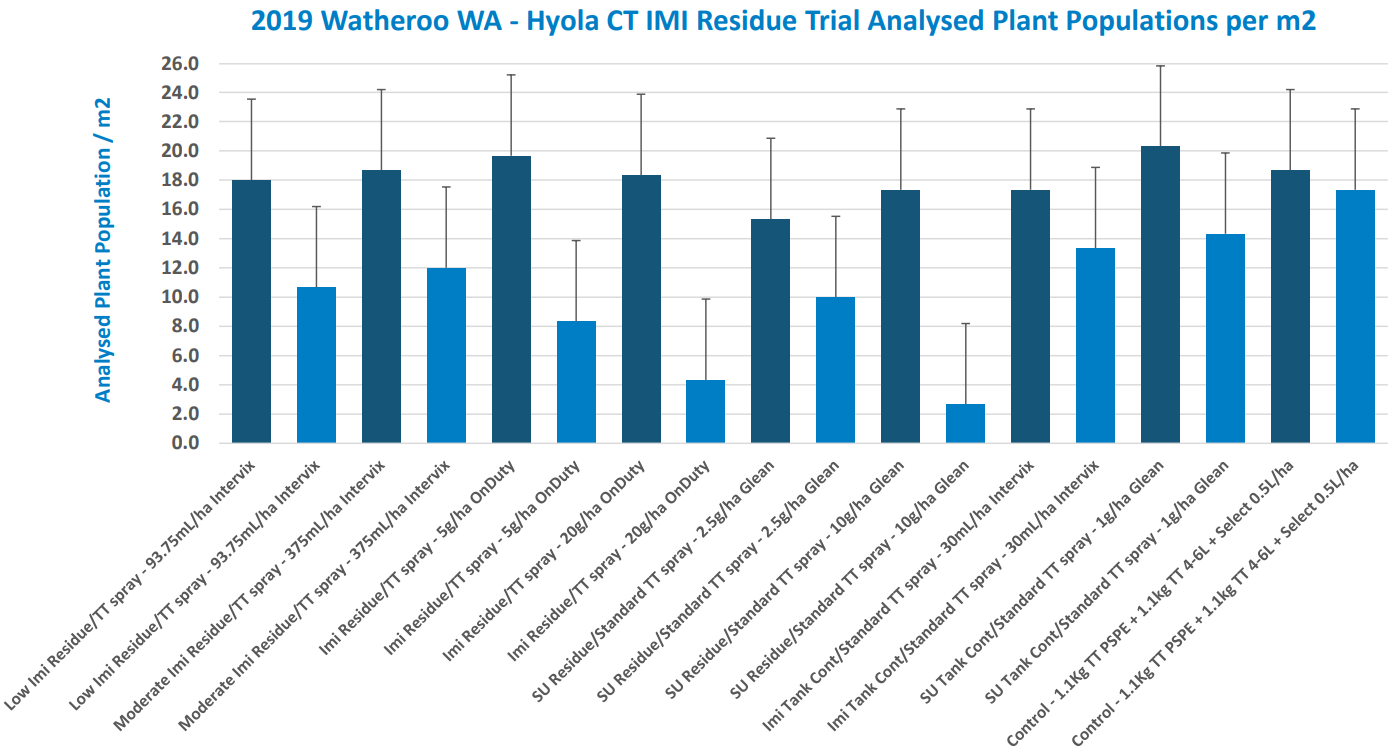
Variations in solubility have effected the IMI chemistry breakdown (less movement for OnDuty® chemistry). 1g of Glean® tank-mix and 30ml Intervix® tank-mix contamination treatments over the top has significantly impacted plant growth and yield in the OP TT variety with no inbuilt CL protection.
The CT dual stack technology has shown very good resilience to Intervix® and OnDuty®, as well as moderate tolerance to SU chemistry residue applied PSPE in this site. The OP TT variety had significantly lower yields with the higher rate of Intervix®, the low and high rates of OnDuty® applied PSPE as well as the low and high rates of Glean®applied
SITE HERBICIDE BEHAVIOUR SUMMARY
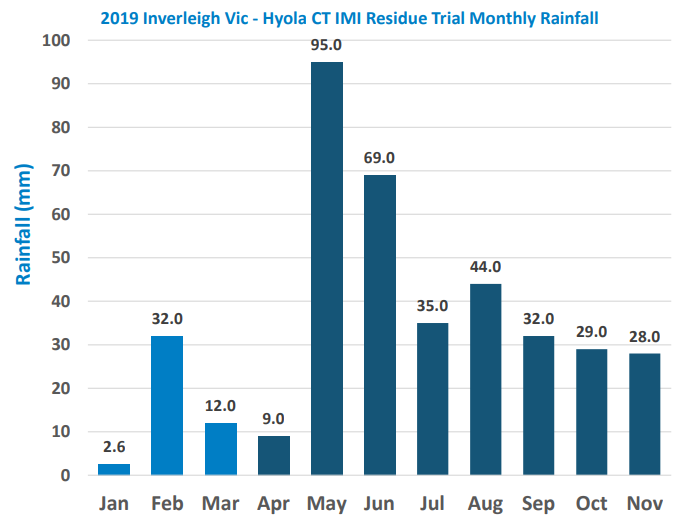
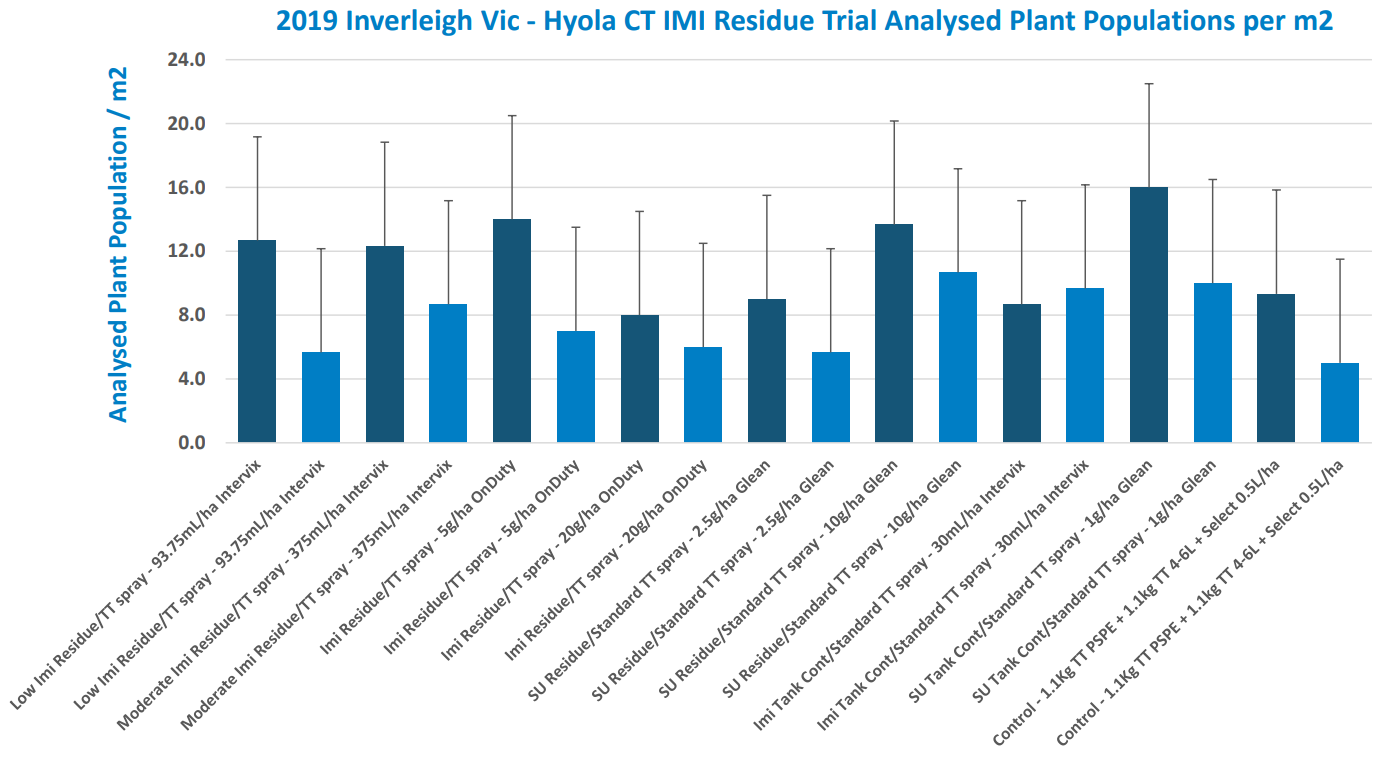
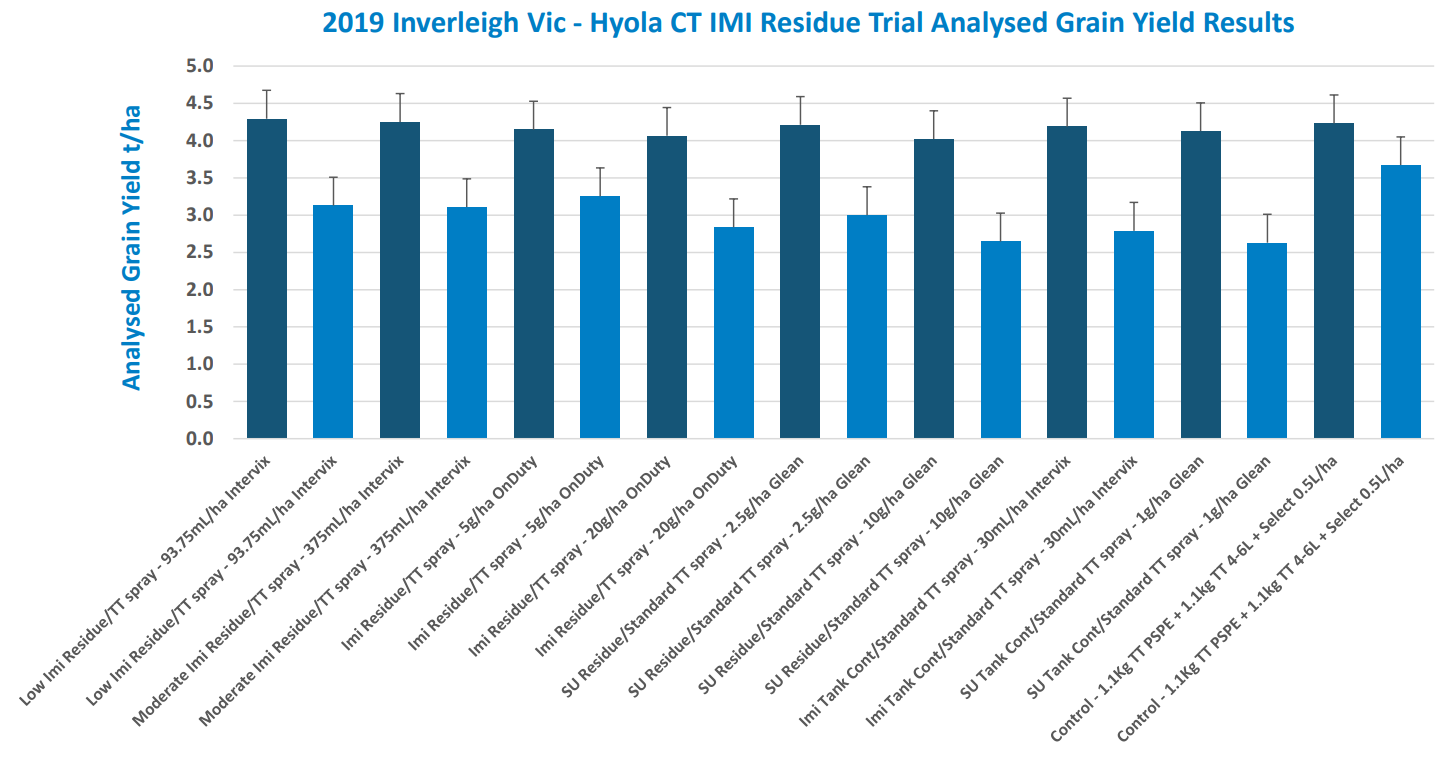
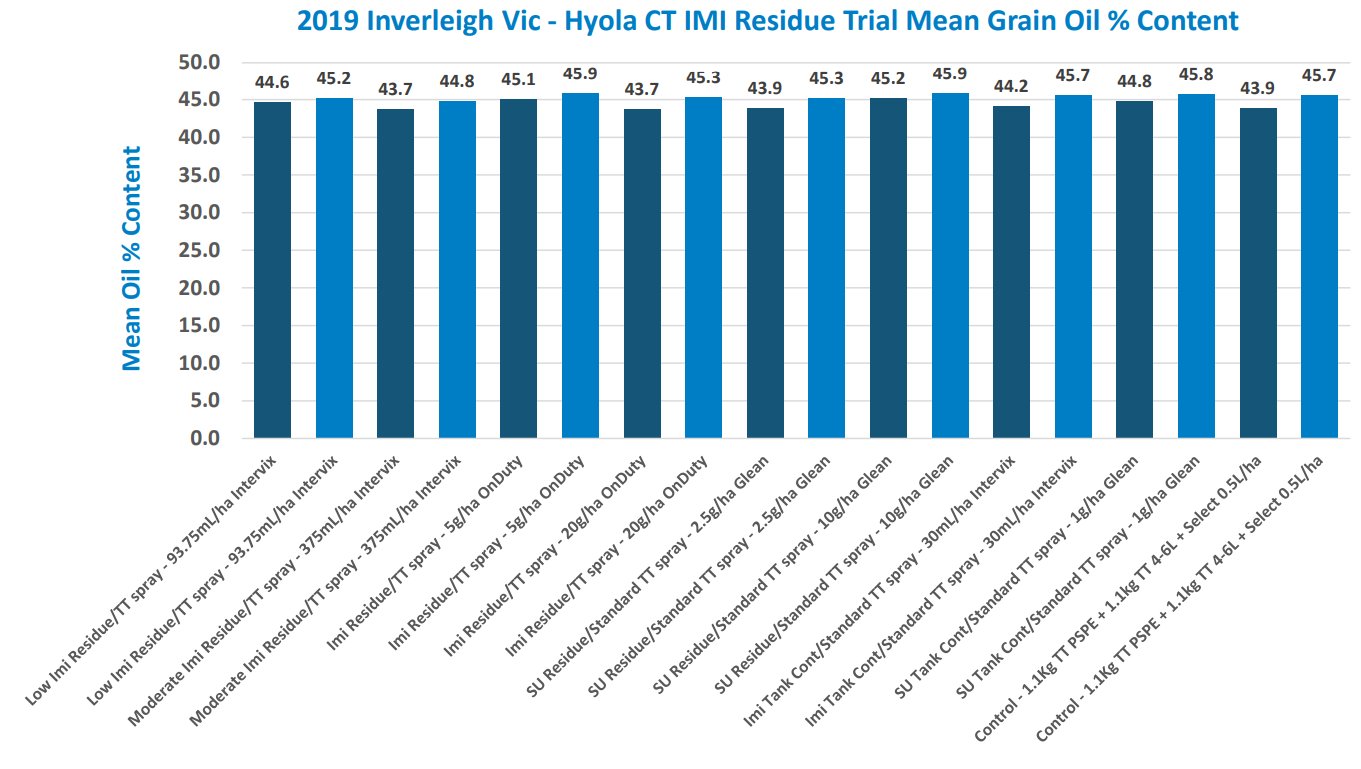
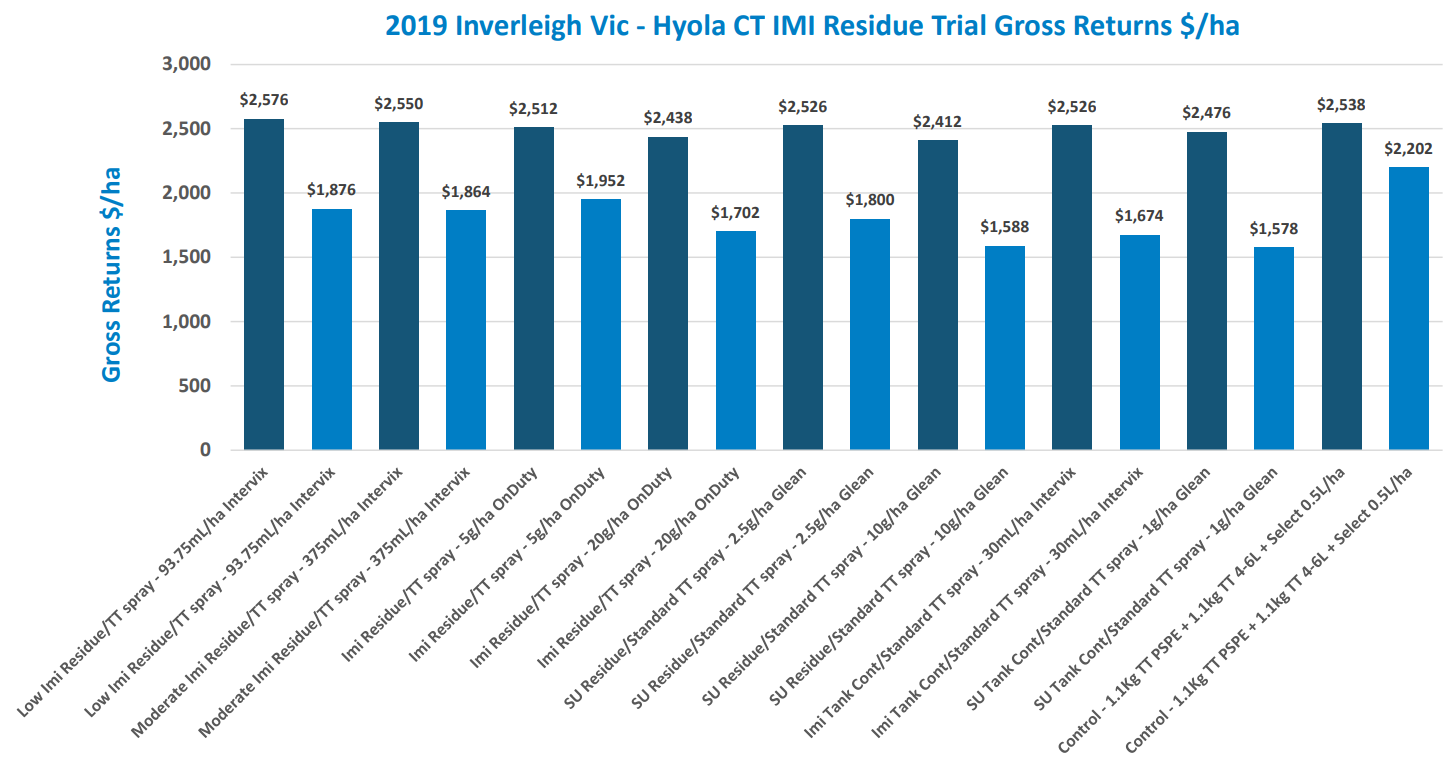
2019 Inverleigh Vic
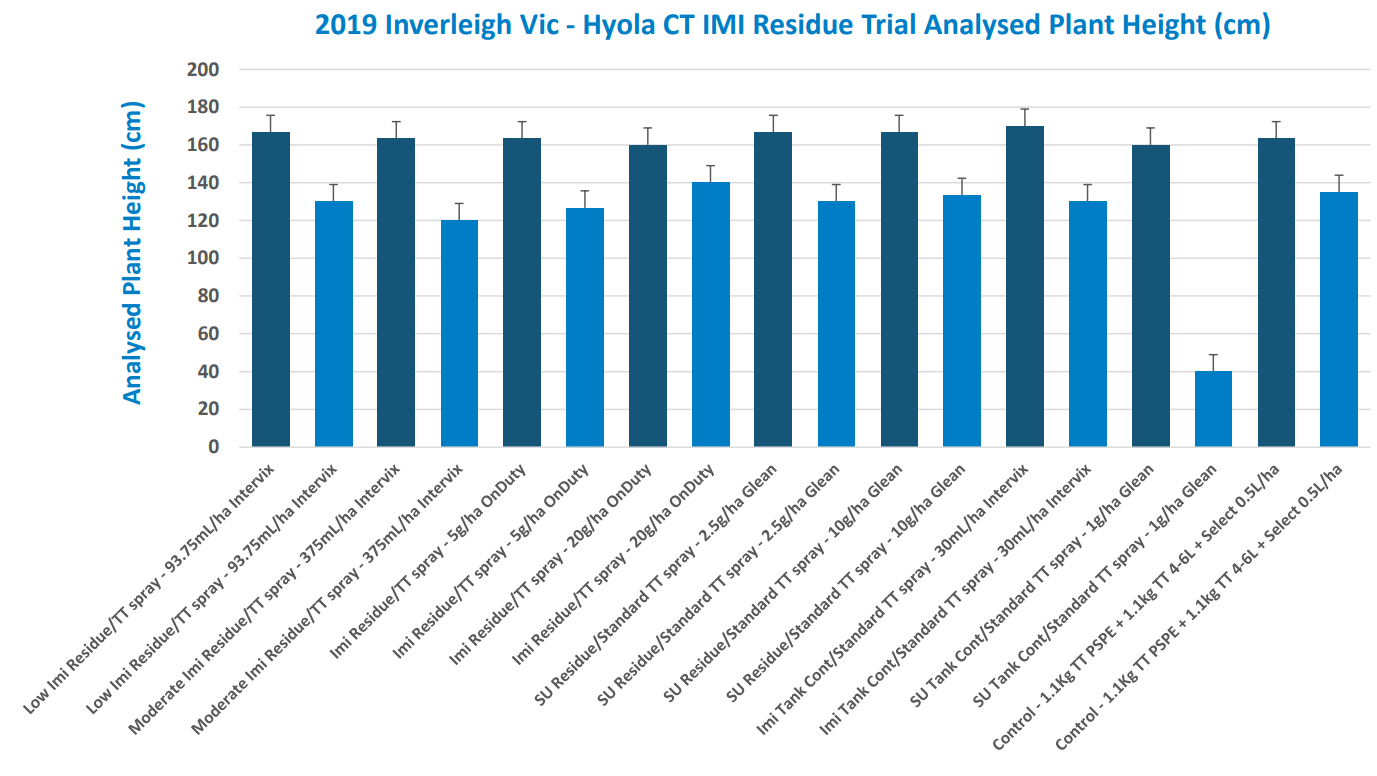
Sown on the 22nd April into a heavier soil type with drier profile conditions led to varied establishment effects and lower than expected or targeted plant populations. Topsoil 0-10cm 6.4 pH at neutral levels leading into slightly acidic 5.2 at 10-20cm would have affected both movement and breakdown of IMI & SU chemistry as well as movement into a zone within the roots of the young seedlings. The canola plants were impeded initiallyby dryish conditions and then affected in plant number and leaf growth by specific treatments in May to August with some good follow-up rains.
Neutral soil both in the top 10cm may have led to some breakdown of IMI type chemistries whereas in the 10-20cm depth where acidity was higher, faster Glean® breakdown may have occurred. Reasonable amounts of IMI remained in the root profile especially with the higher rates of both Intervix® and OnDuty® where the damage to yield was significant.
Mid-way through the crops growth, when the plants were more developed, symptoms developed quite effectively with some treatments, possibly due to more acid at depth where root development making it into the chemical zone provided damage to varying levels depending on treatment, however all IMI and SU treatments significantly impacted the OP TT variety yield results.
Variations in solubility have effected the IMI chemistry breakdown (less movement for OnDuty® chemistry). 1g of Glean® tank-mix and 30ml Intervix® tank-mix contamination treatments over the top has significantly impacted plant growth and yield in the OP TT variety with no inbuilt CL protection. The CT dual stack technology has shown very good resilience to Intervix® and OnDuty®, as well as good tolerance to SU chemistry residue applied PSPE in this site. The OP TT variety had significantly lower yields with the low and high rates of Intervix® and OnDuty® applied PSPE as well as the low and high rates of Glean® applied PSPE. Grain oil% contents for the OP TT and the CT technology did not show any major deviation from the control treatments in this higher rainfall site.
SITE HERBICIDE BEHAVIOUR SUMMARY
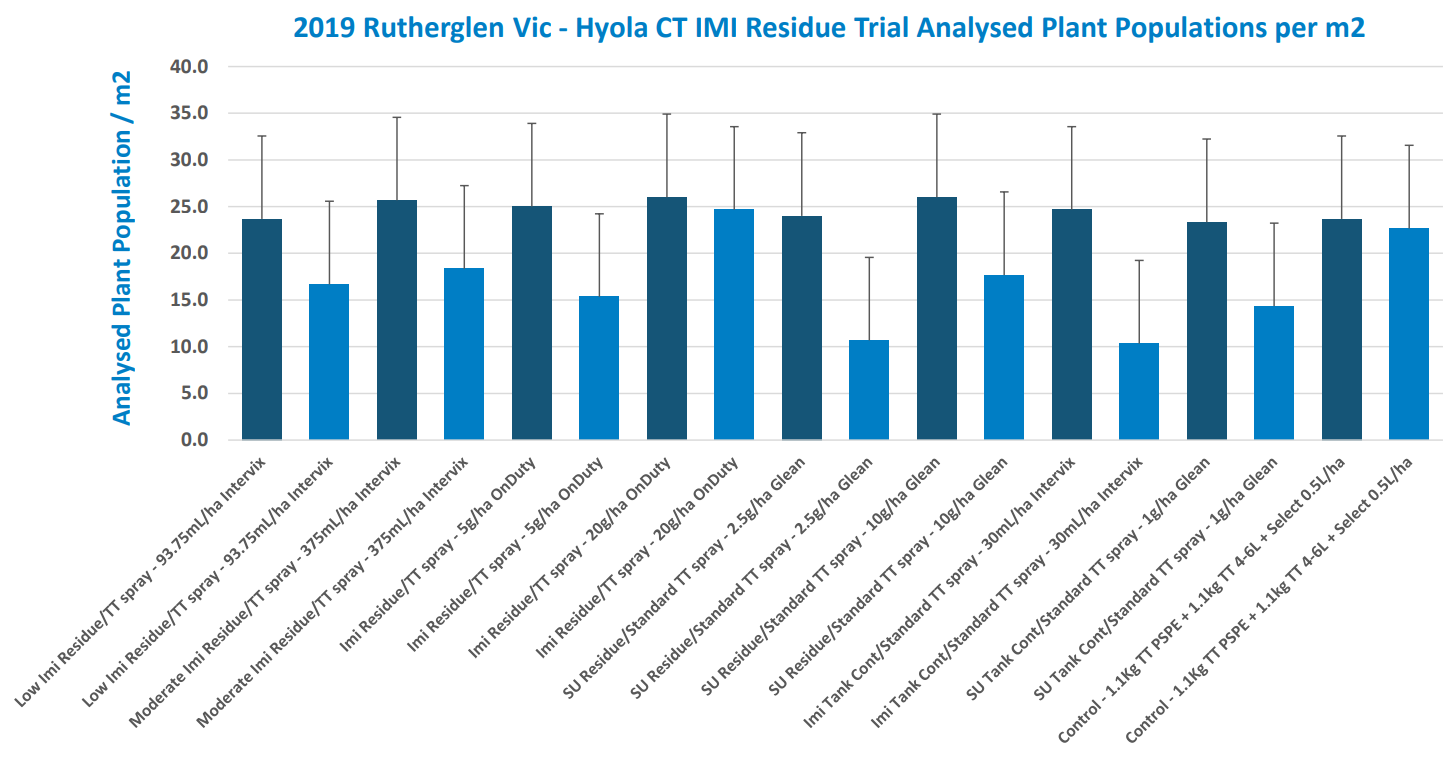
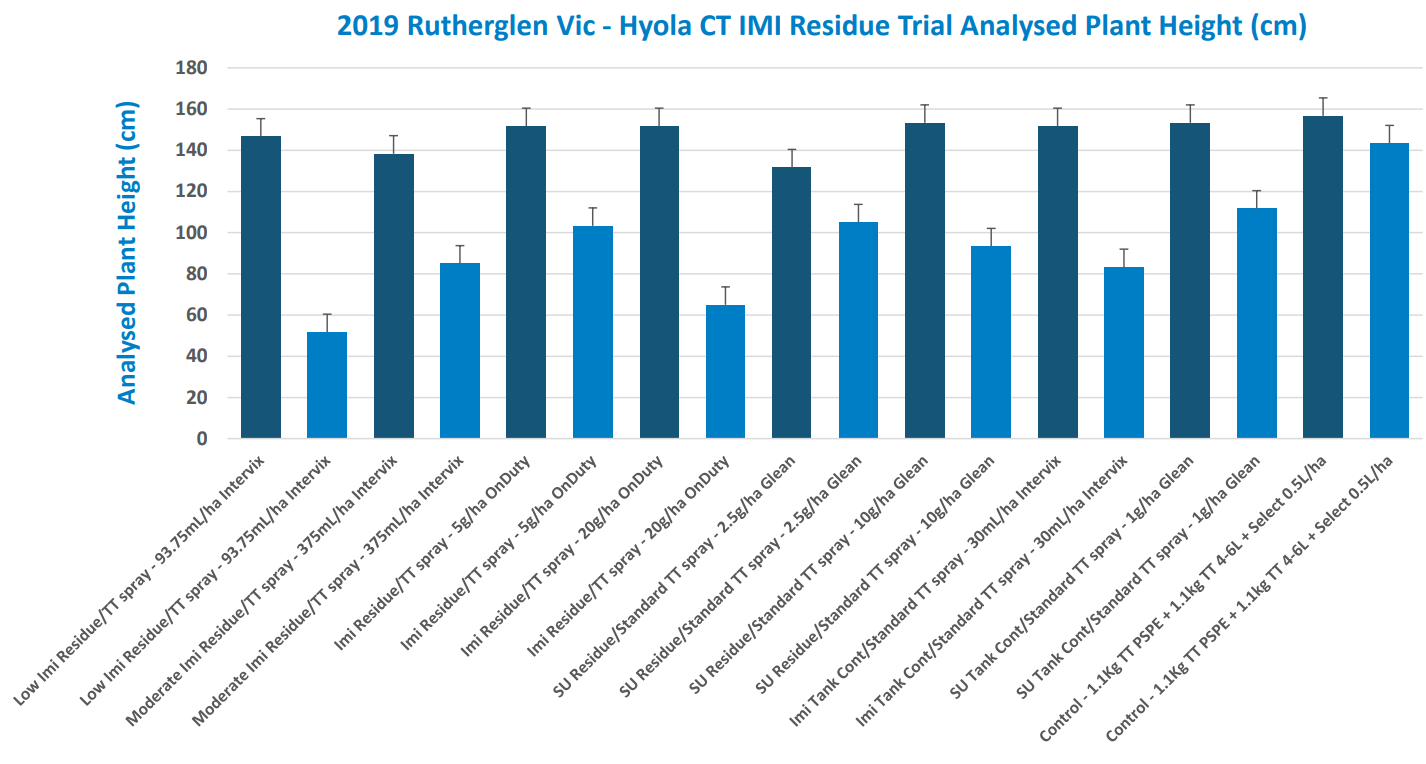
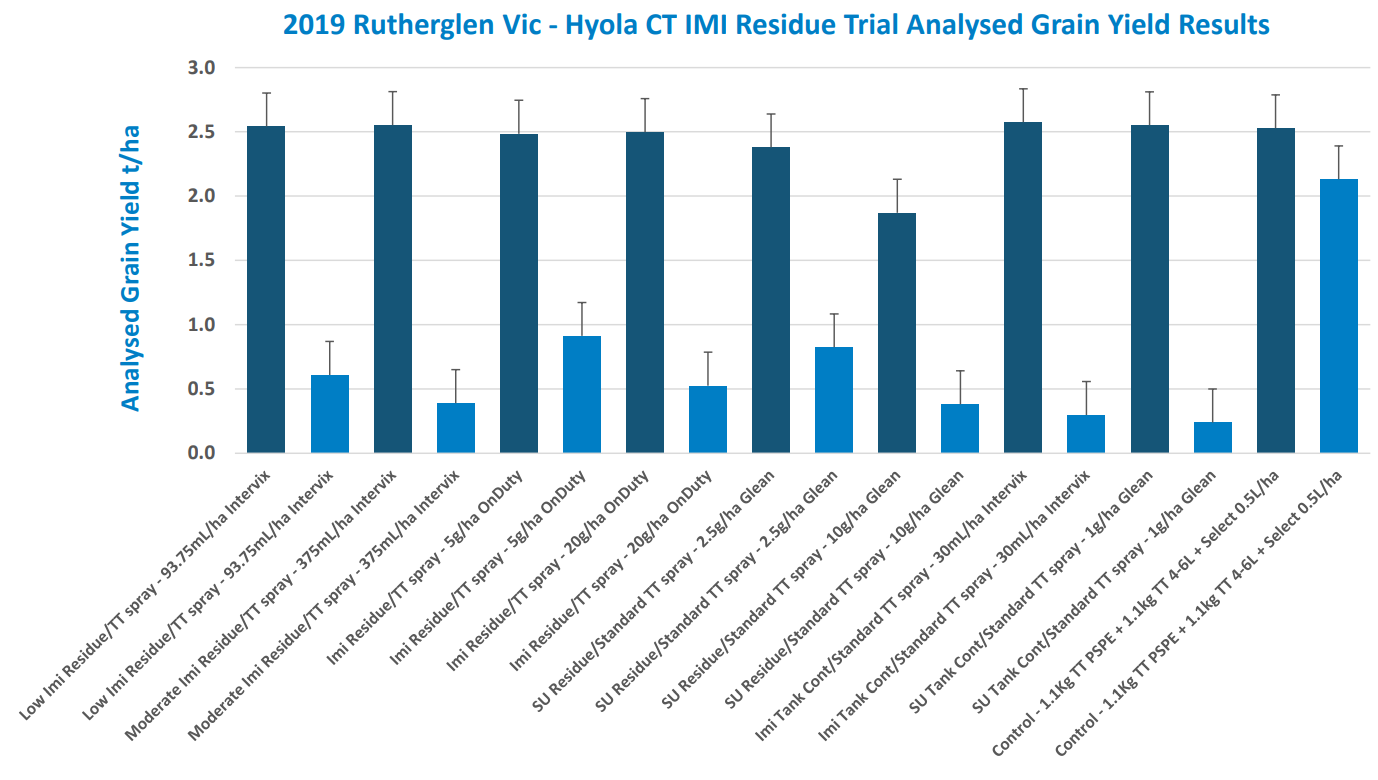
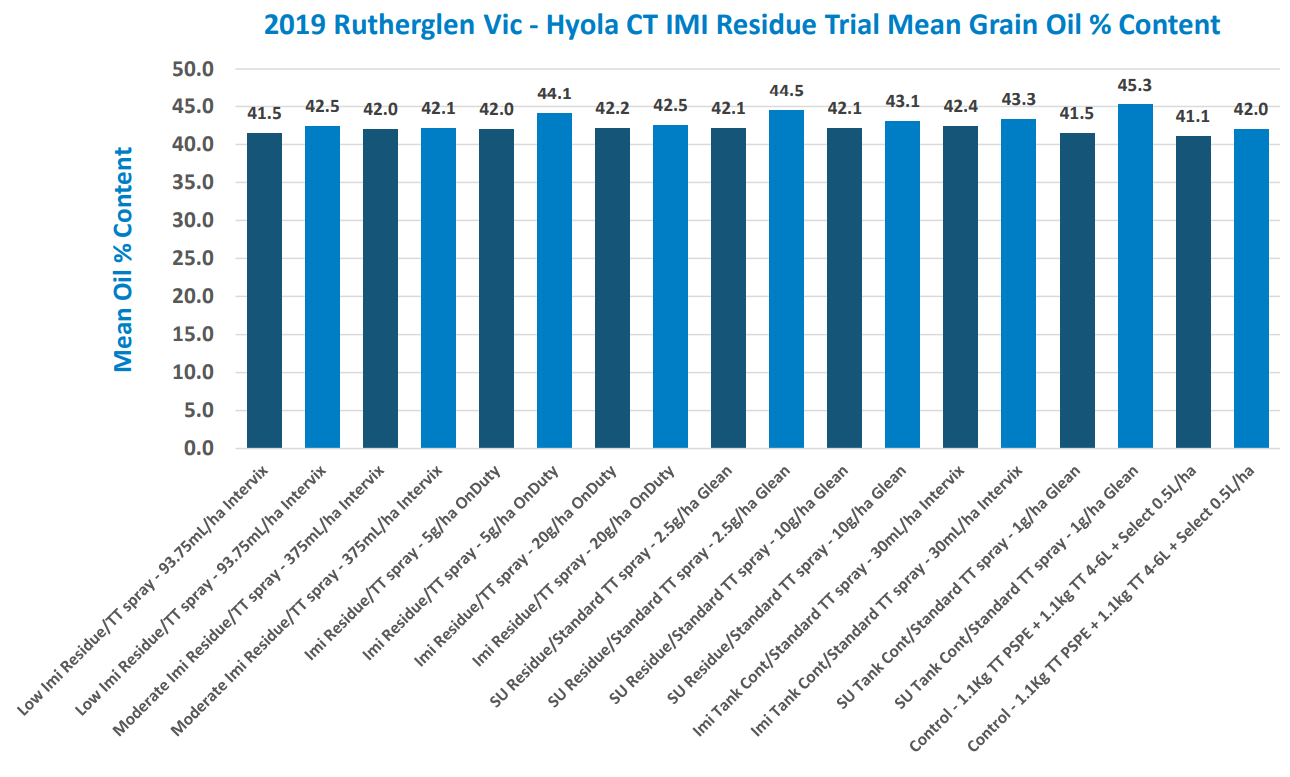
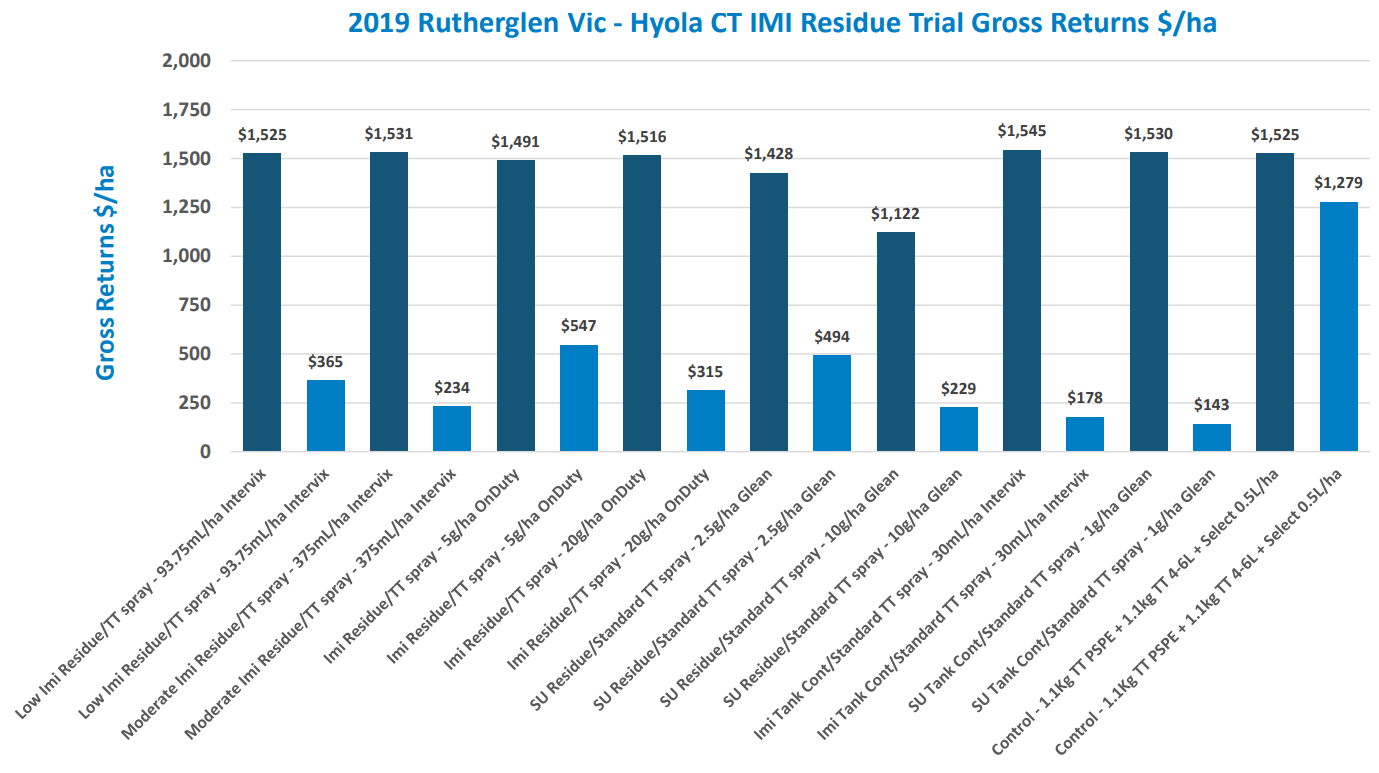
2019 Rutherglen Vic
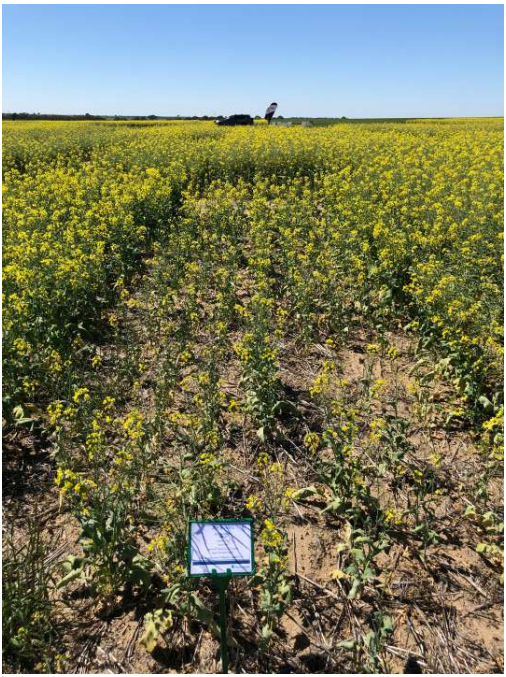
Sown on the 30th April provided good establishment with any variability mainly due to soil conditions conditions and pH related IMI & SU movementwithin the root zone of the young seedlings. The canola plants grew actively in all plots with many treatments taking effect early and visual symptoms were easily observable. Many treatments showed classic effects of damage associated with the actual chemistry treatments applied PSPE.
Acid soils (pH 4.9 - top 10cm and pH 4.6 in 10-20cm may have led to faster Glean® breakdown where as not the case of IMI chemistry. IMI chemistry appears to be have dispersed throughout the root zone which has led to significant damage as expected. When the plants were older, the treatments took even bigger effect and the resultant plant populations, plant height and grain yields reflect the significant reductions.
Variations in solubility have effected the IMI chemistry breakdown (less movement for OnDuty® chemistry). 1g of Glean® tank-mix and 30ml Intervix® tank-mix contamination treatments over the top has significantly impacted plant growth and yield in the OP TT variety with no inbuilt CL protection.
The CT dual stack technology has shown very good resilience to Intervix® and OnDuty®, as well as moderate tolerance to SU chemistry residue applied PSPE in this site, however the higher rate of Glean® applied PSPE significantly reduced the yield of the CT technology at this site.
The OP TT variety had significantly lower yields with the low and high rates of Intervix® and OnDuty® applied PSPE as well as the low and high rates of Glean® applied PSPE.
SITE HERBICIDE BEHAVIOUR SUMMARY
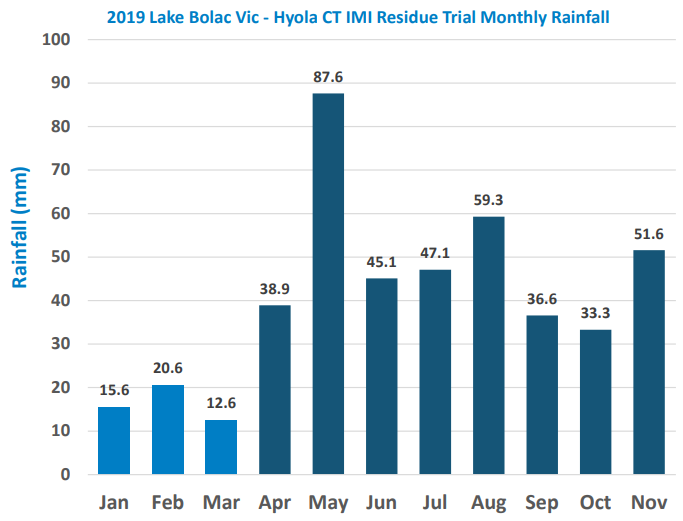
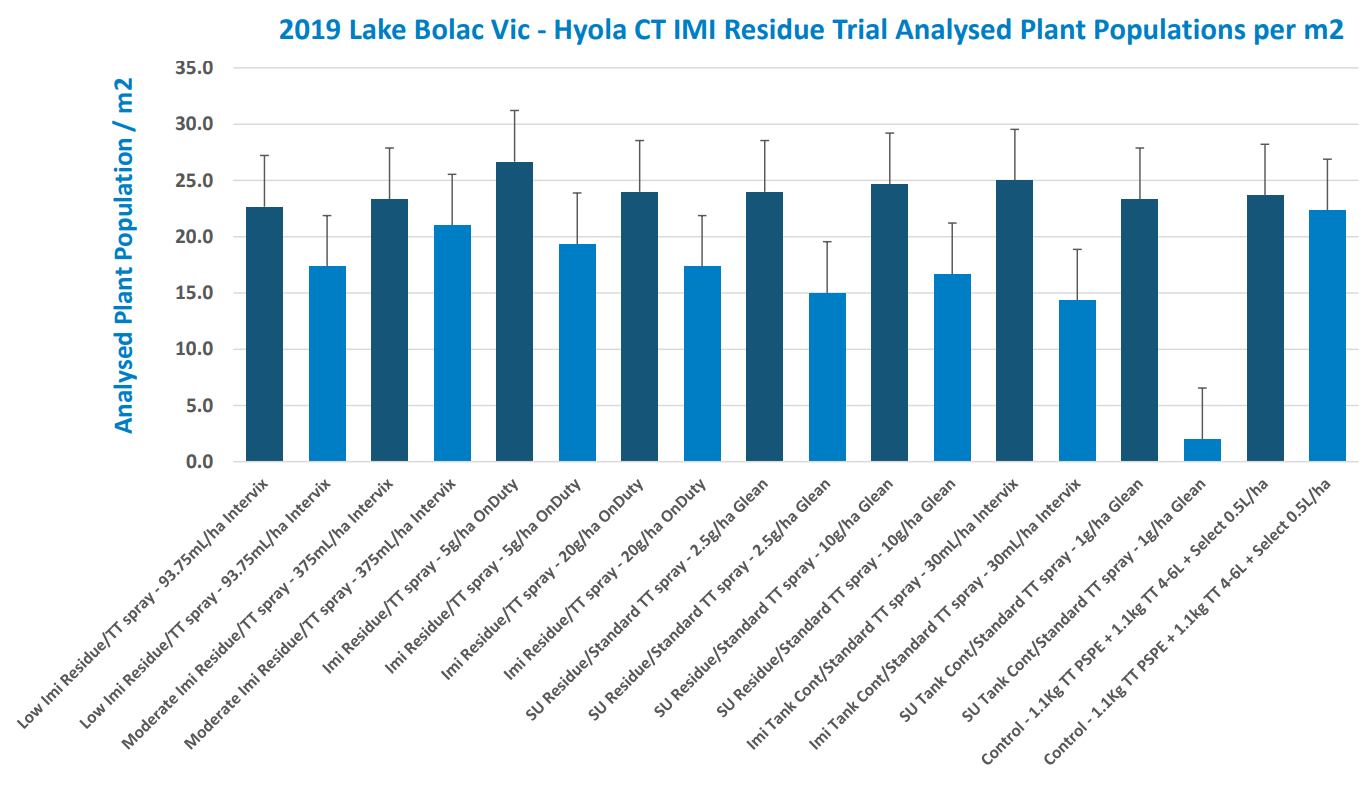
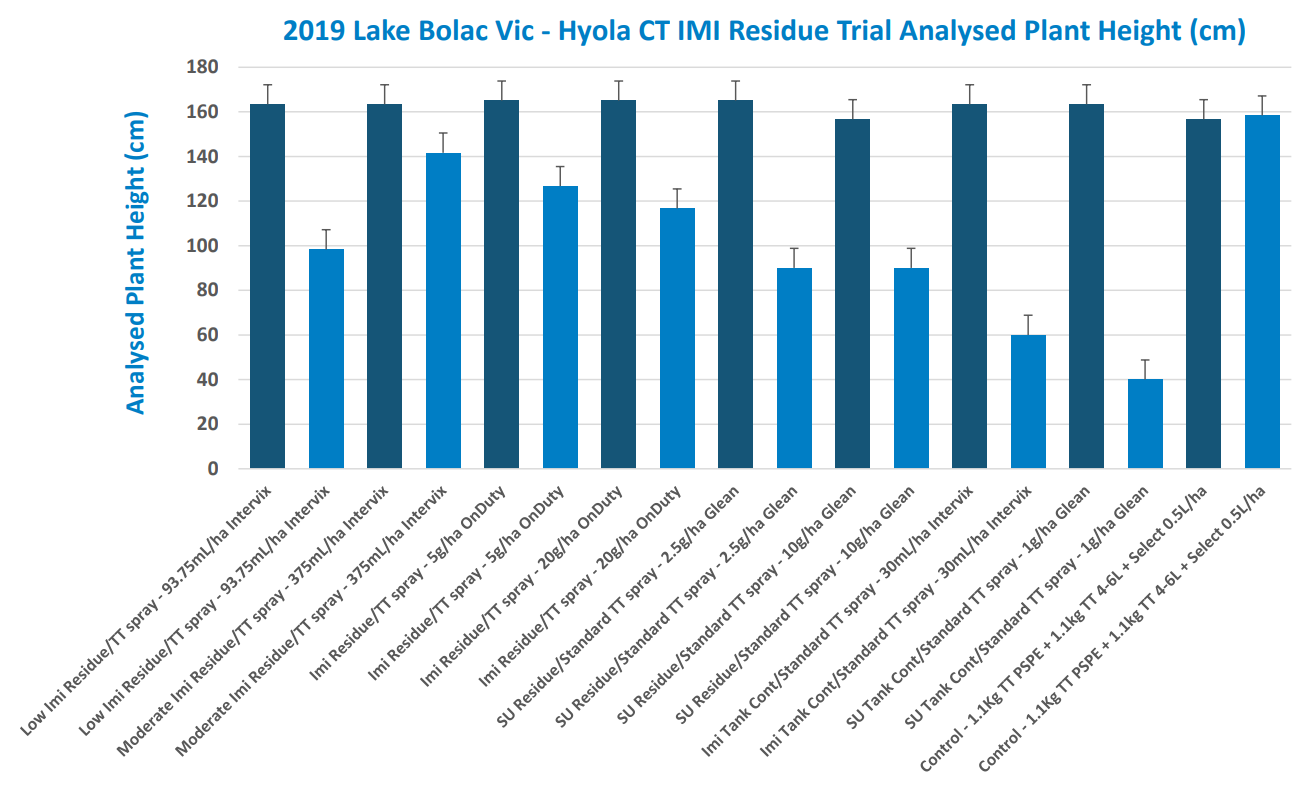
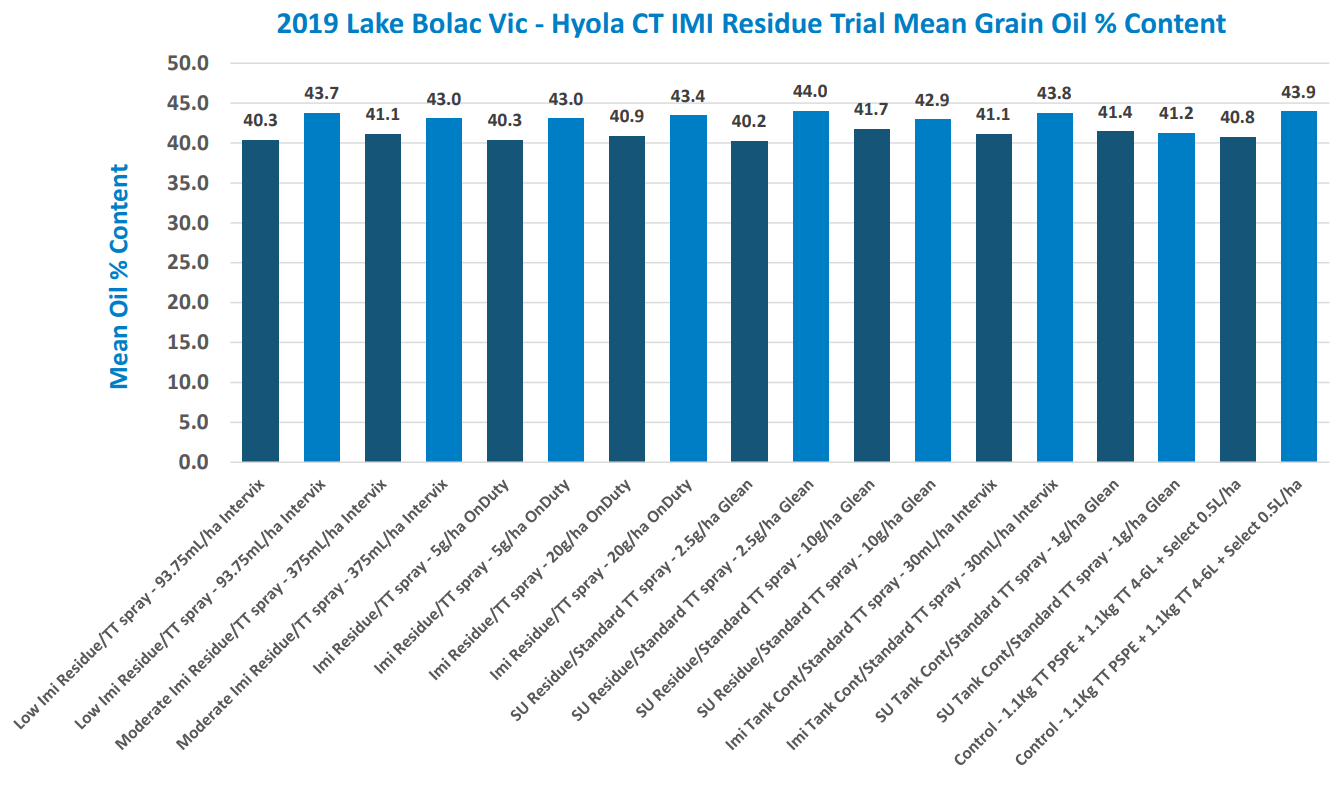
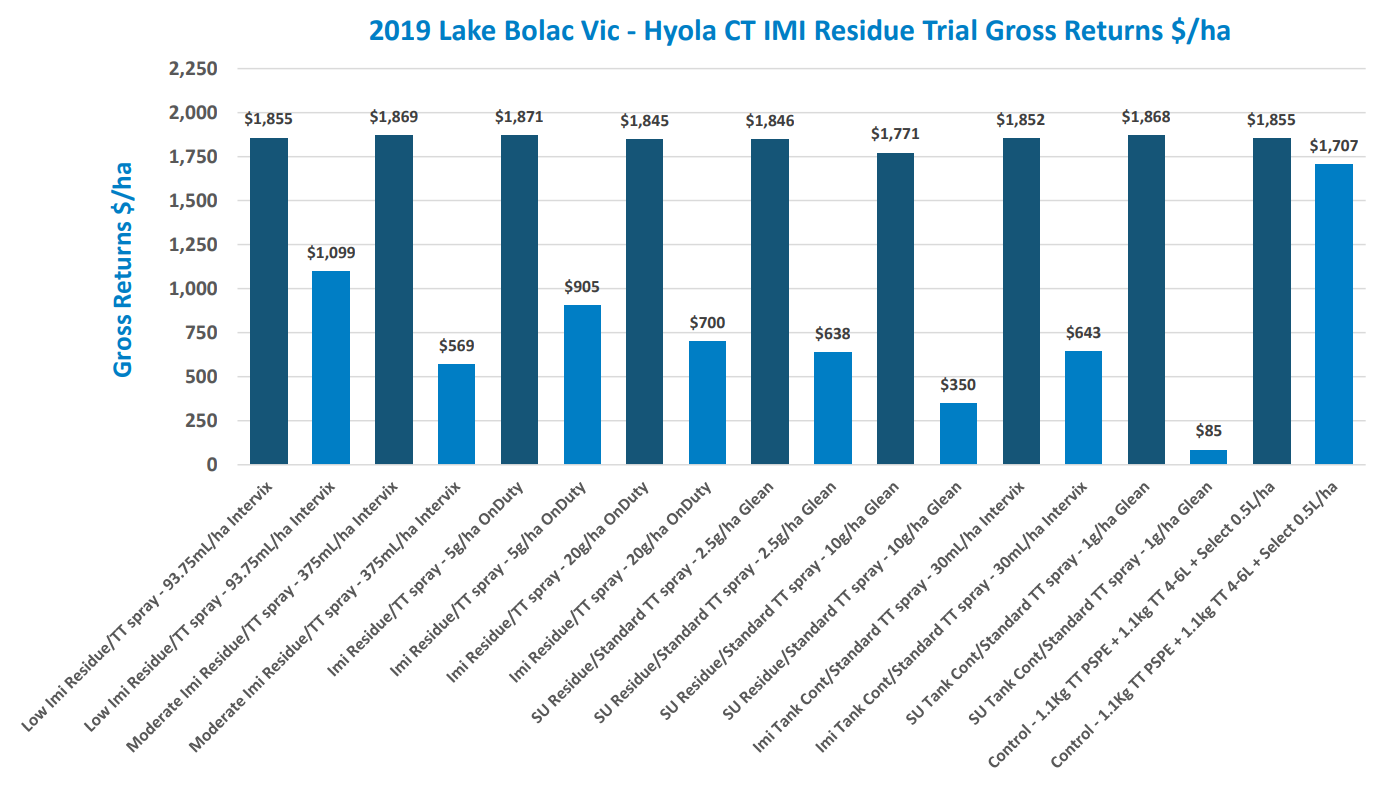
2019 Lake Bolac Vic
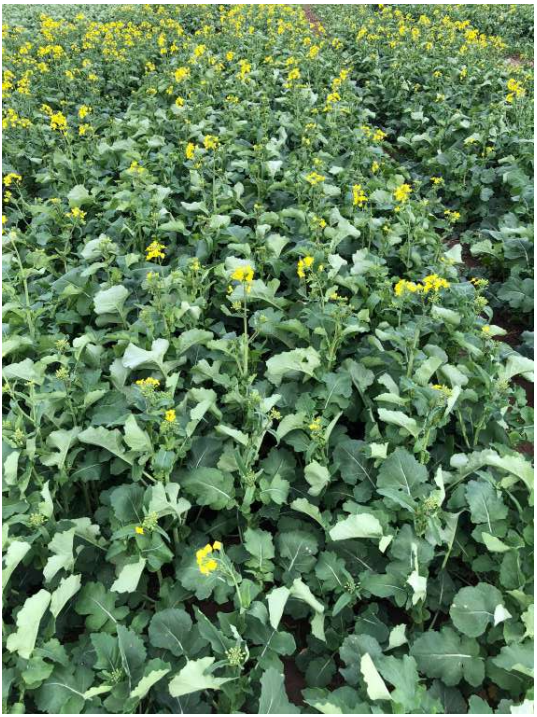
Sown on the 30th April into a heavier brown clay soil type provided good establishment with any variability mainly due to soil conditions and pH related IMI & SU movement within the root zone of the young seedlings. The canola plants grew actively in all plots with some treatmentstaking effect early and visual symptoms were easily observable. Many treatments showed classic effects of damage associated with the actual chemistry treatments applied PSPE.
The soil pH (pH 4.8 - top 10cm and pH 5.0 in 10-20cm may have led to faster Glean® breakdown where as not the case of IMI chemistry. The organic carbon level of 1.8% and heavier clay content may have increased the binding effects and slowed breakdown with some of the chemistries applied. IMI chemistry appears to be have dispersed through the active root zone region which has led to significant damage. When the plants were older, the treatments took even bigger effect and the resultant plant populations, plant height and grain yields reflect the significant reductions.
Variations in solubility have effected the IMI chemistry breakdown (less movement for OnDuty® chemistry). 1g of Glean® tank-mix and 30ml Intervix® tank-mix contamination treatments over the top has significantly impacted plant growth and yield in the OP TT variety with no inbuilt CL protection.
The CT dual stack technology has shown very good resilience to Intervix®and OnDuty®, as well as moderate to good tolerance to SU chemistry applied PSPE in this site. The OP TT variety had significantly lower yields with the low and high rates of Intervix®and OnDuty® applied PSPE as well as the low and high rates of Glean® applied PSPE.
Grain oil% contents for the OP TT and the CT technology did not show any major deviation fromthe control treatments in this higher rainfall site.
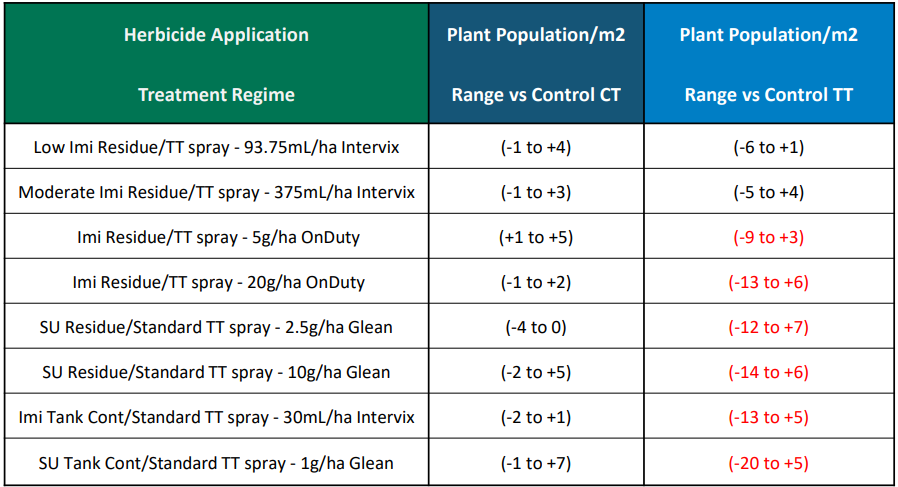
ANALYSED PLANT POPULATIONS PER M2
ANALYSED PLANT POPULATIONS PER M2
ANALYSED PLANT POPULATIONS PER M2
ANALYSED PLANT POPULATIONS PER M2
ANALYSED PLANT POPULATIONS PER M2
ANALYSED PLANT POPULATIONS PER M2
ANALYSED PLANT HEIGHT (CM)
ANALYSED PLANT HEIGHT (CM)
ANALYSED PLANT HEIGHT (CM)
ANALYSED PLANT HEIGHT (CM)
ANALYSED PLANT HEIGHT (CM)
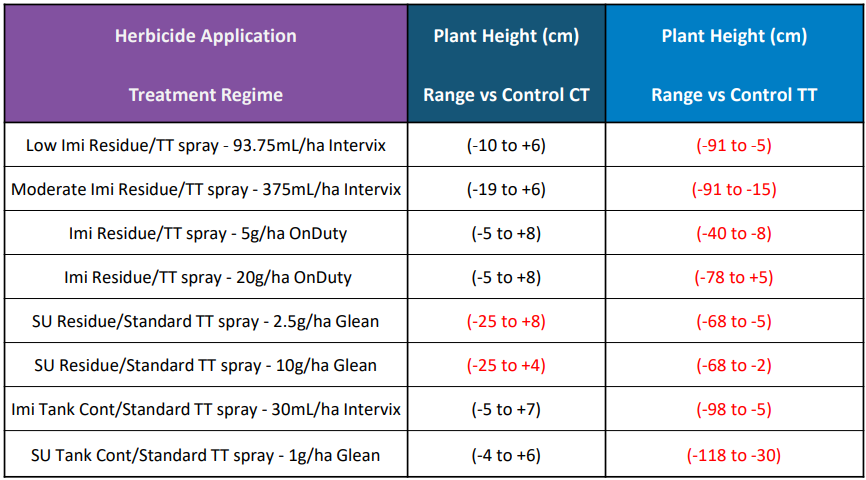
ANALYSED PLANT HEIGHT (CM) RESULTS SUMMARY
ANALYSED GRAIN YIELD (T/HA)
ANALYSED GRAIN YIELD (T/HA)
ANALYSED GRAIN YIELD (T/HA)
ANALYSED GRAIN YIELD (T/HA)
ANALYSED GRAIN YIELD T/HA
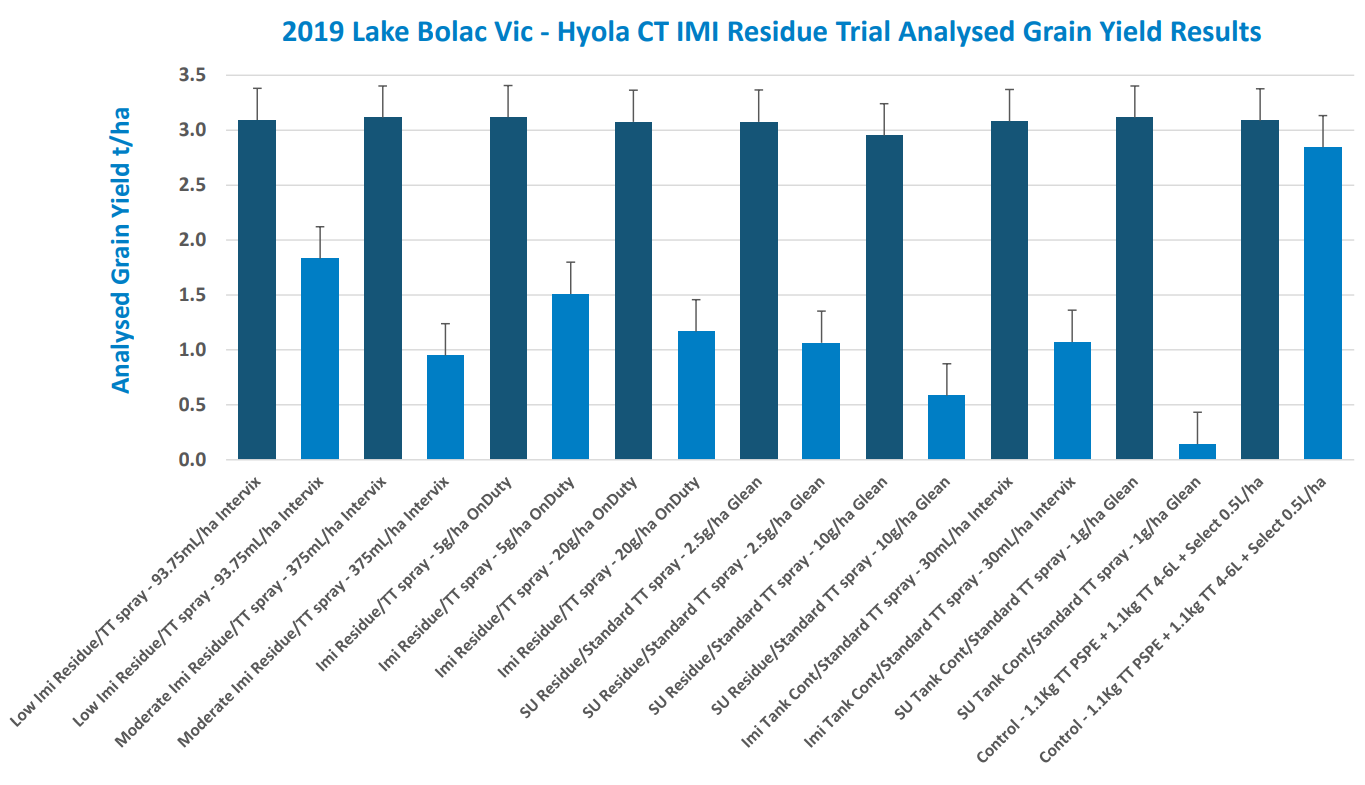
ANALYSED GRAIN YIELD T/HA RESULTS SUMMARY
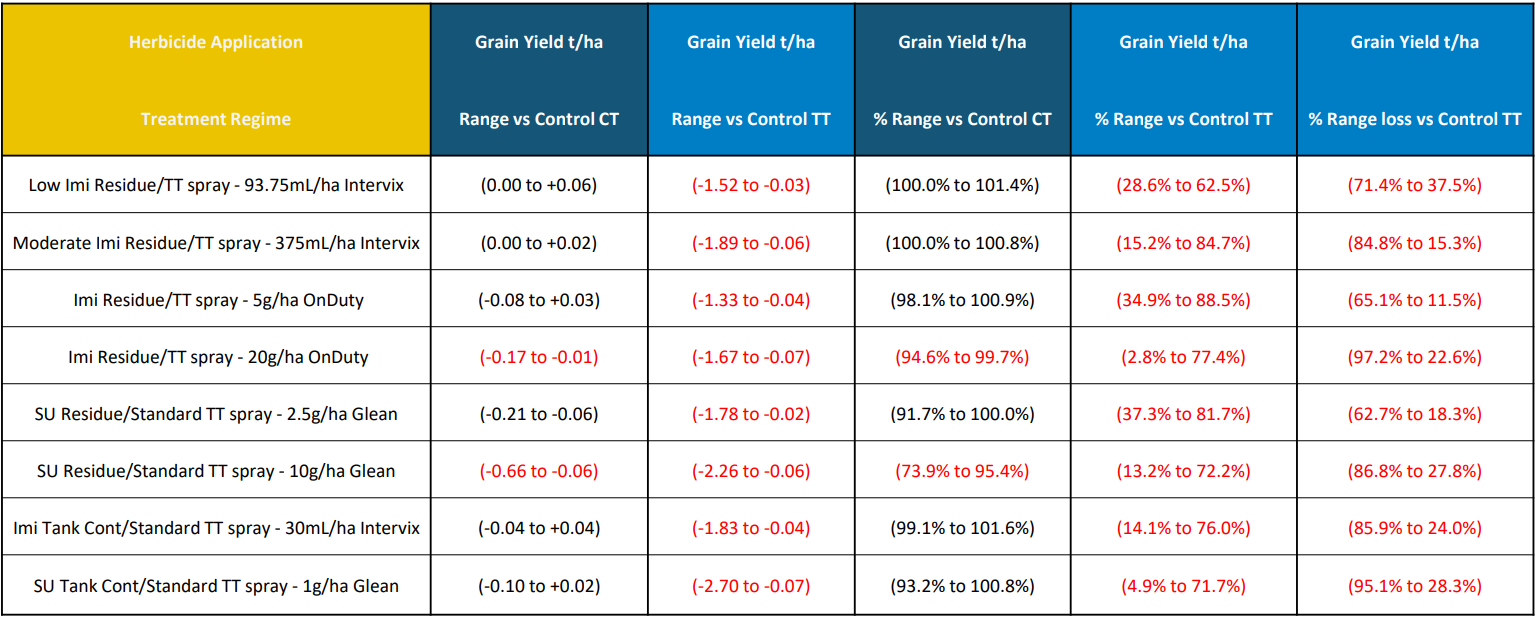
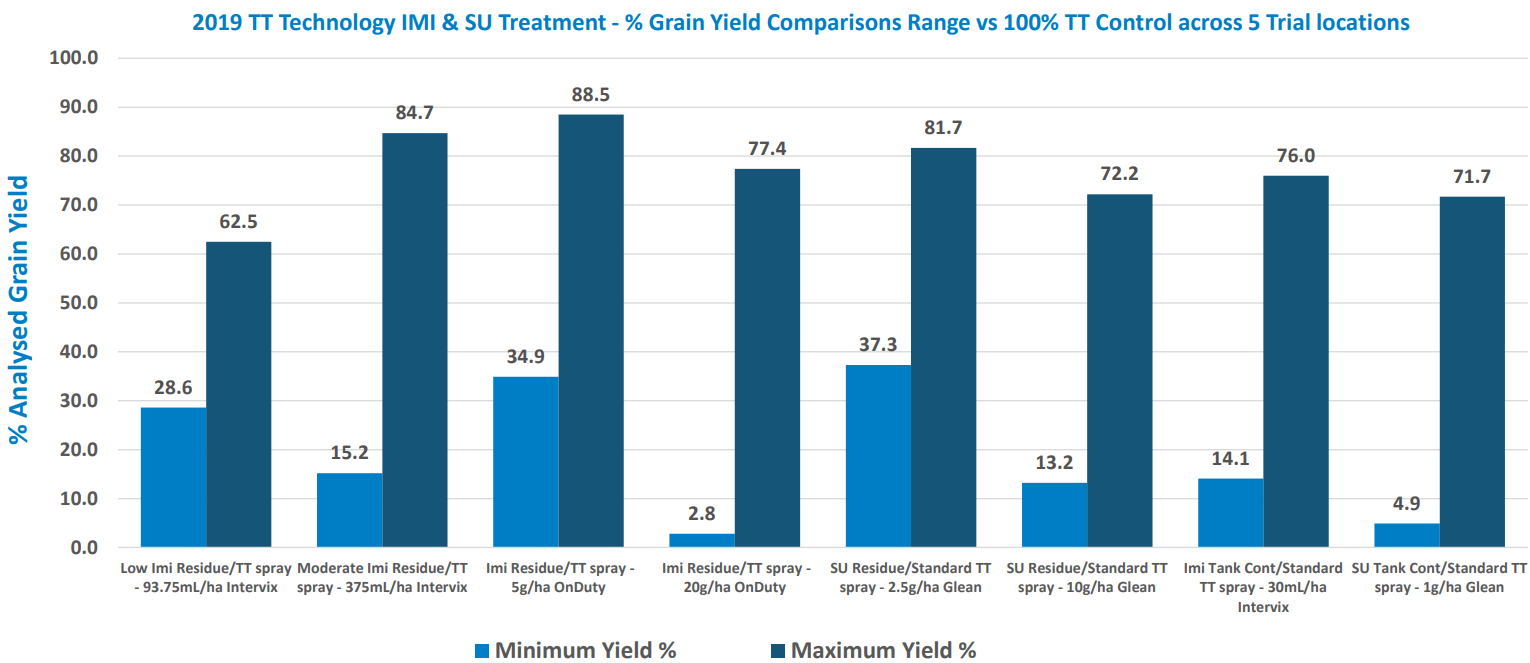
OP TT % RANGE OF YIELD RESPONSES VS 100% TT CONTROL
MEAN GRAIN OIL%
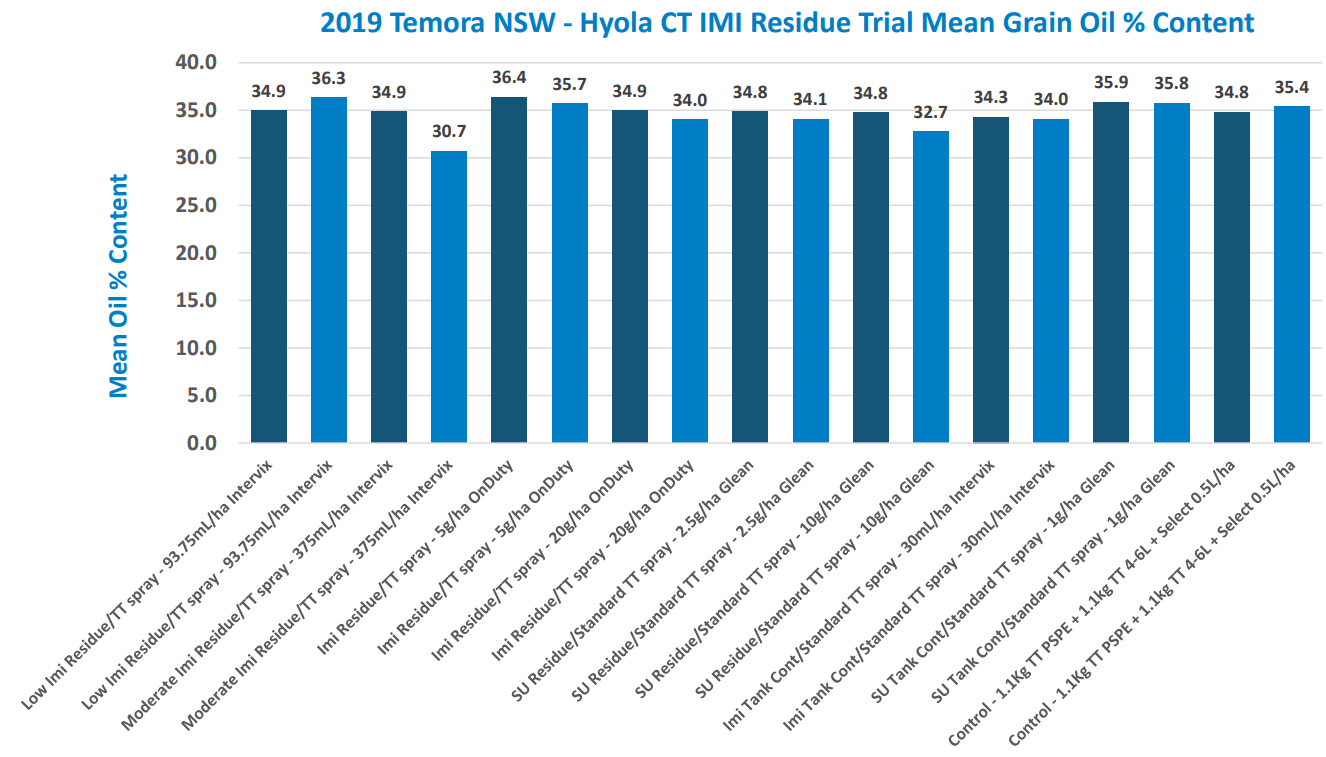
MEAN GRAIN OIL%
MEAN GRAIN OIL%
MEAN GRAIN OIL%
MEAN GRAIN OIL%
GROSS RETURNS $/HA
GROSS RETURNS $/HA
GROSS RETURNS $/HA
GROSS RETURNS $/HA
GROSS RETURNS $/HA
GROSS RETURNS $/HA RESULTS SUMMARY