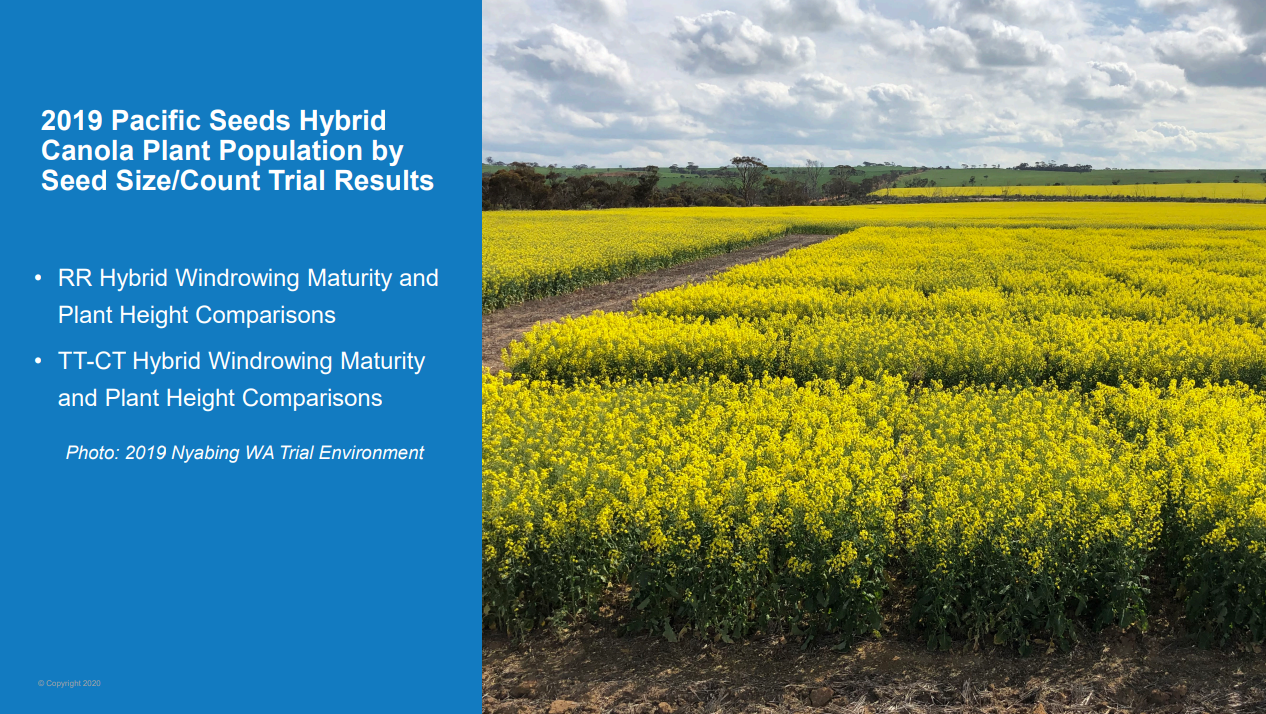
Download The

2019 Hyola® TD - Plant Population by Seed Count/Size Trial Details
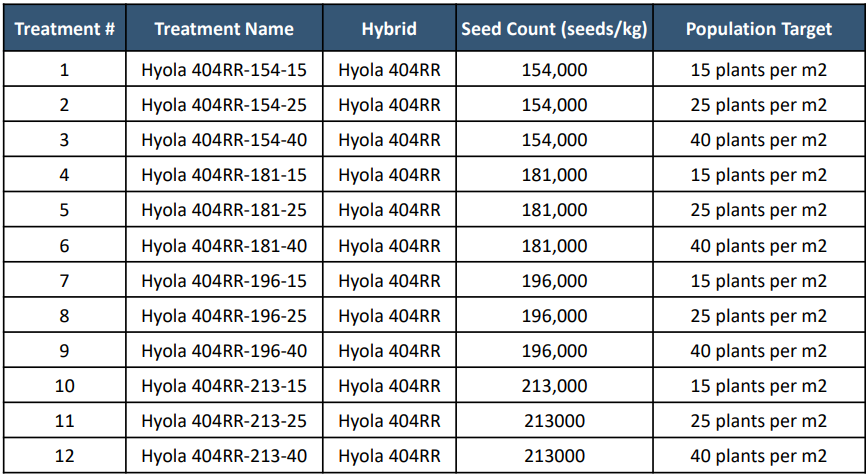
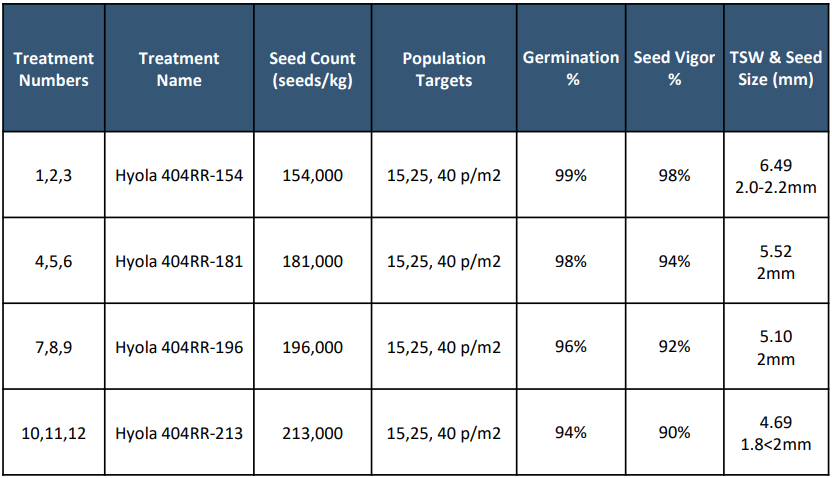
2019 Hyola® TD Plant Population by Seed Size Trial – RR Treatment Listing
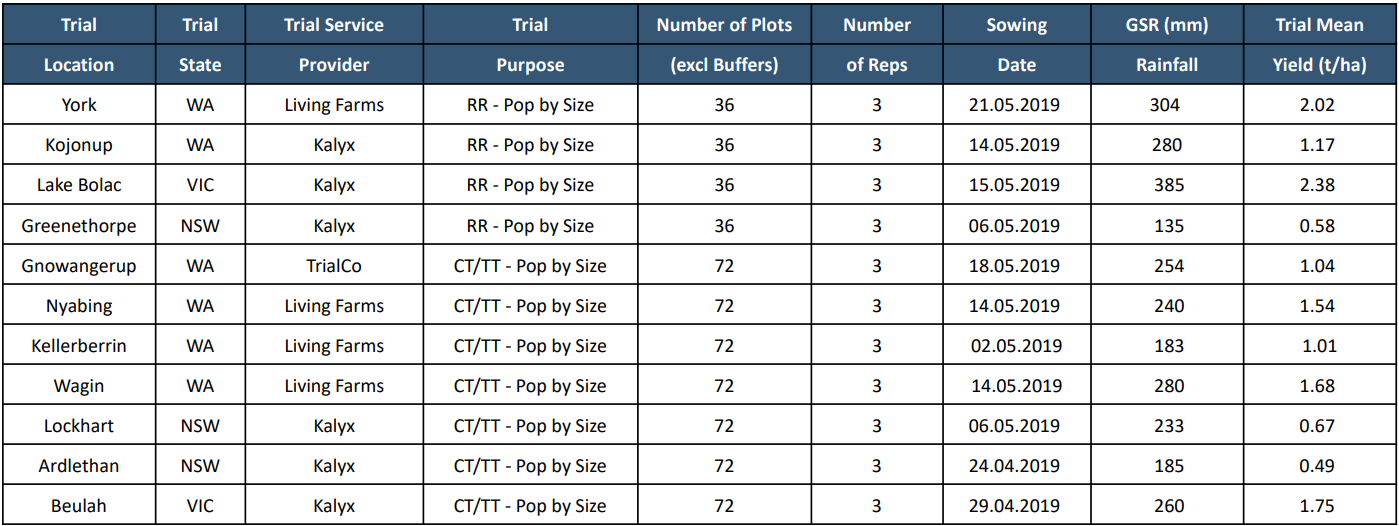
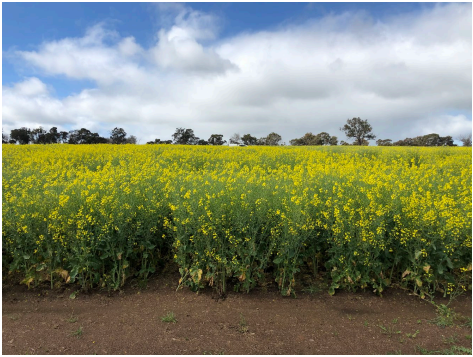
2019 Greenethorpe NSW - RR Trial Environment
2019 Hyola® TD Plant Population by Seed Size Trial – RR Quality Details
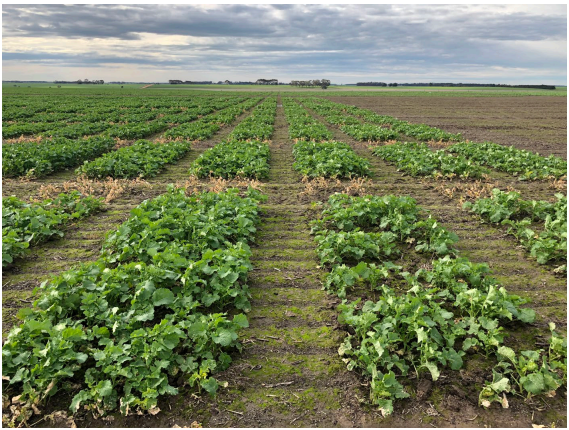
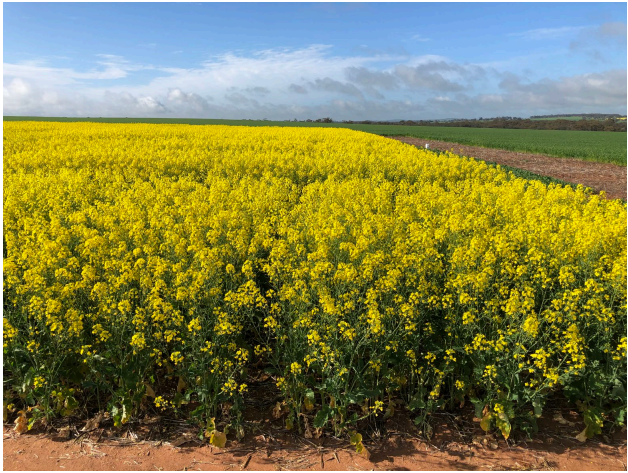
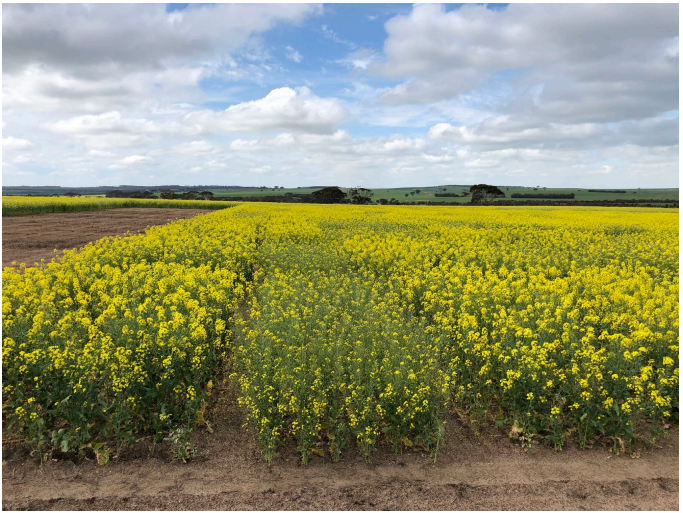
2019 Lake Bolac VIC - RR Trial Environment
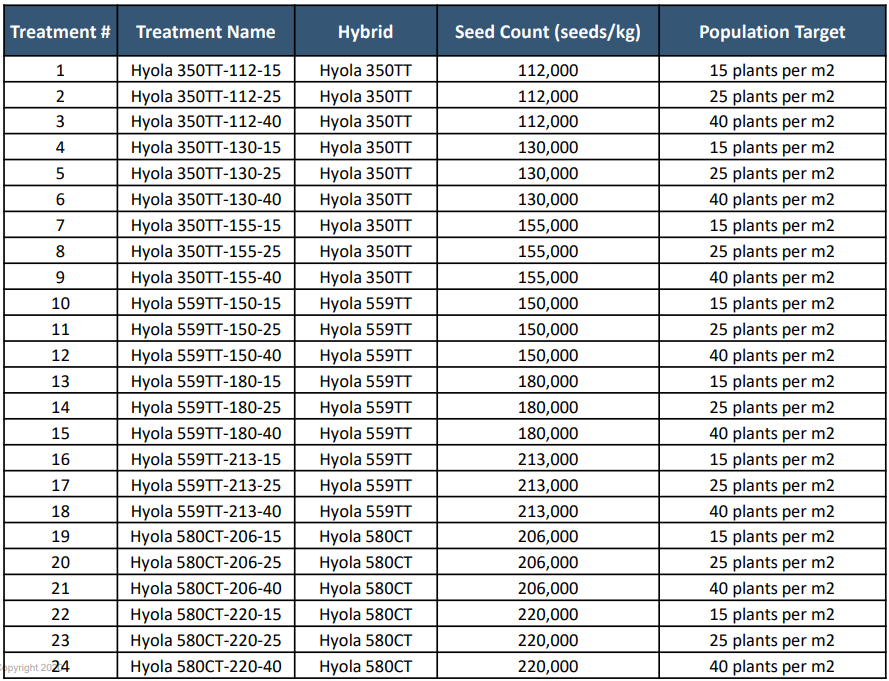
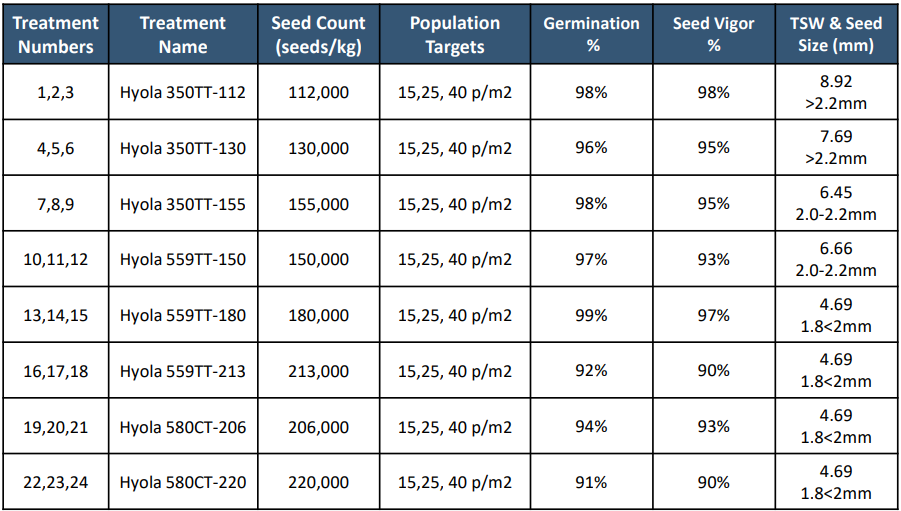
2019 Hyola® TD Plant Population by Seed Size Trial – TT/CT Treatment Listing
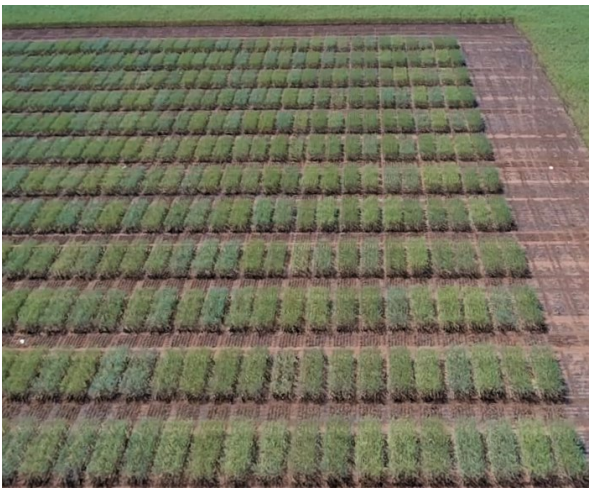
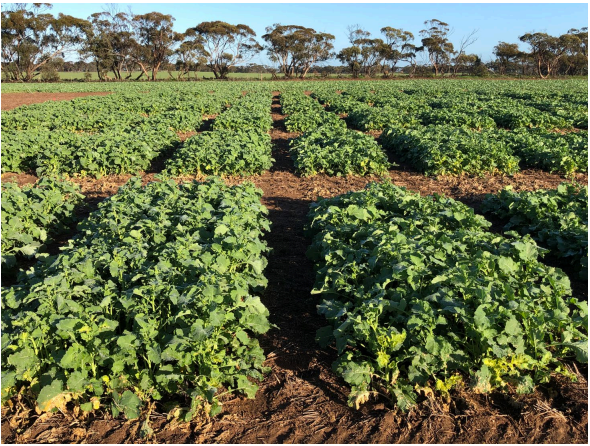
2019 Lockhart NSW - TT/CT Trial Environment
2019 Hyola® TD Plant Population by Seed Size Trial – TT/CT Treatment Quality Details
2019 Beulah VIC - TT/CT Trial Environment
2019 Hyola® TD Plant Population by Seed Size RR Technology Trials
Mean Agronomic Results – 4 Environments
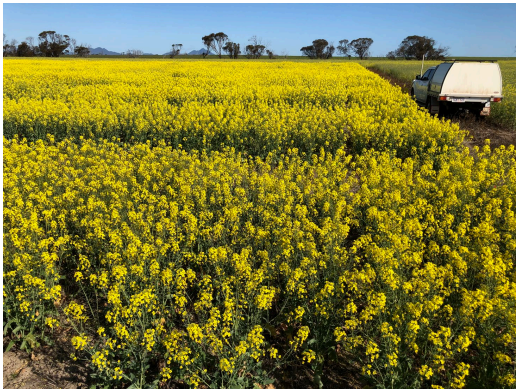
2019 York WA RR Trial Environment
2019 Hyola® TD Plant Population by Seed Size TT-CT Technology Trials
Mean Agronomic Results – 7 Environments
2019 Wagin WA TT-CT Trial Environment
2019 Hyola® TD Plant Population Achieved vs Target Results – RR Technology
Hyola® 404RR - Mean % of Target Population Achieved across 4 Environments
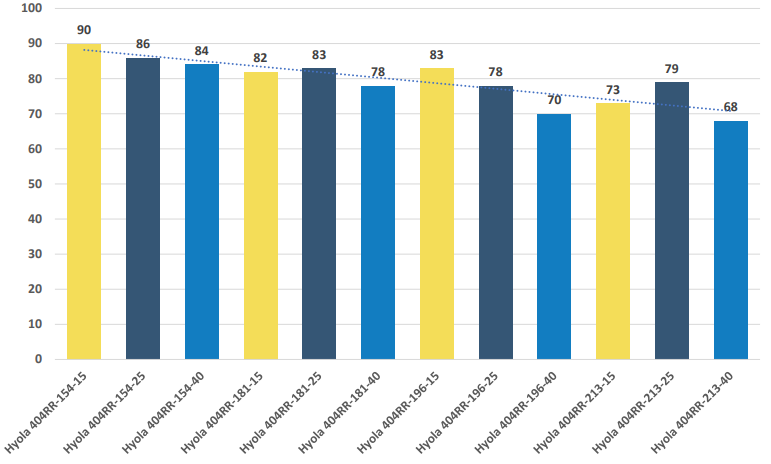

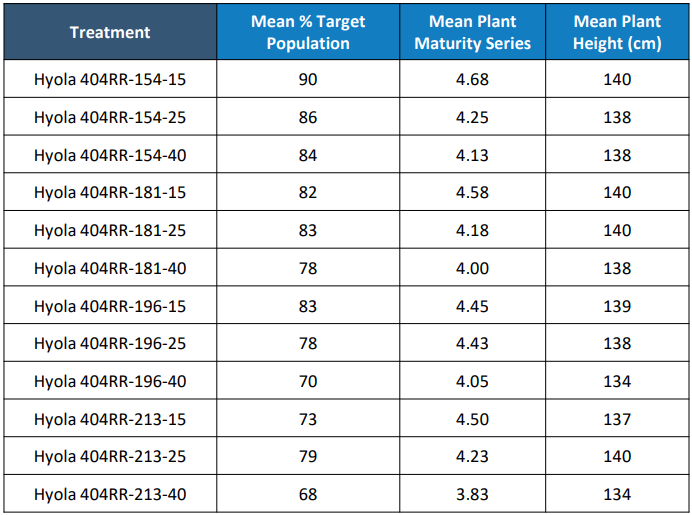
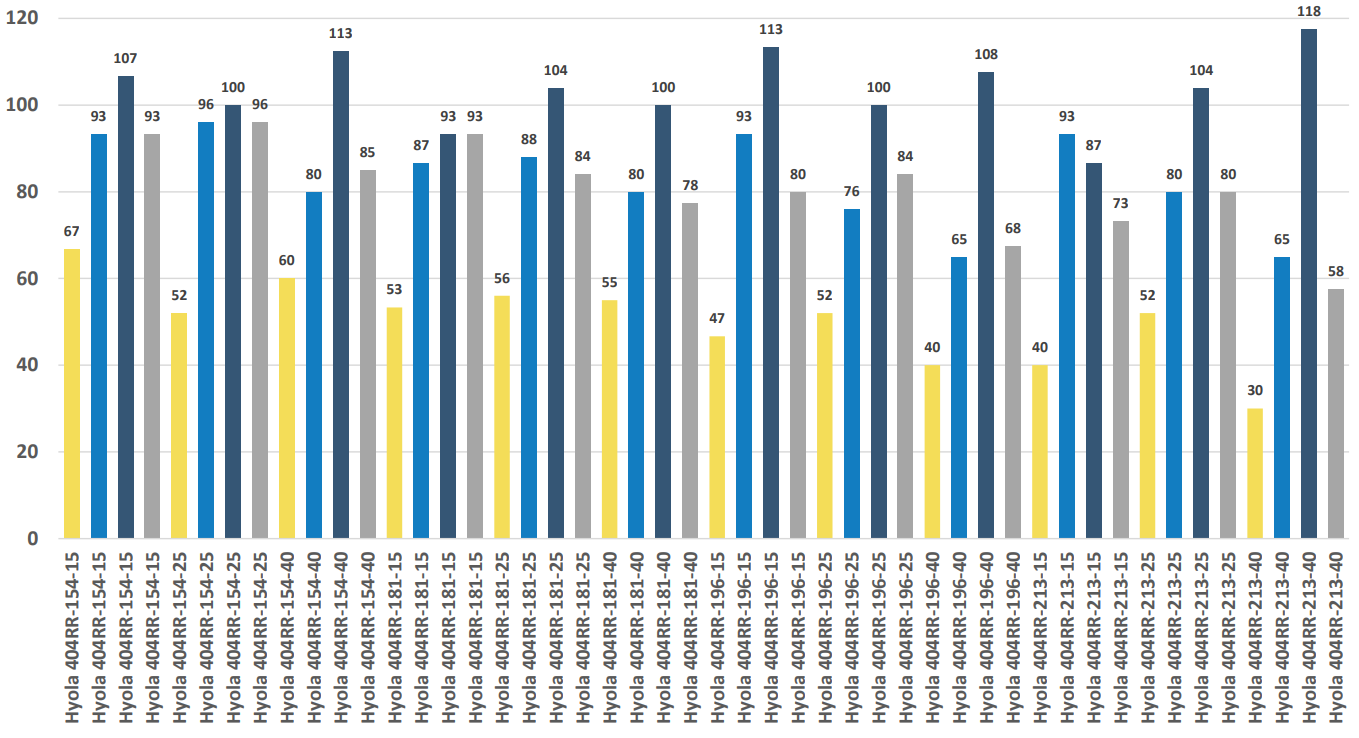
2019 Hyola® TD Plant Population Achieved vs Target Results – RR Technology
Hyola® 404RR - Mean % of Target Population Achieved by Treatment across 4 Environments
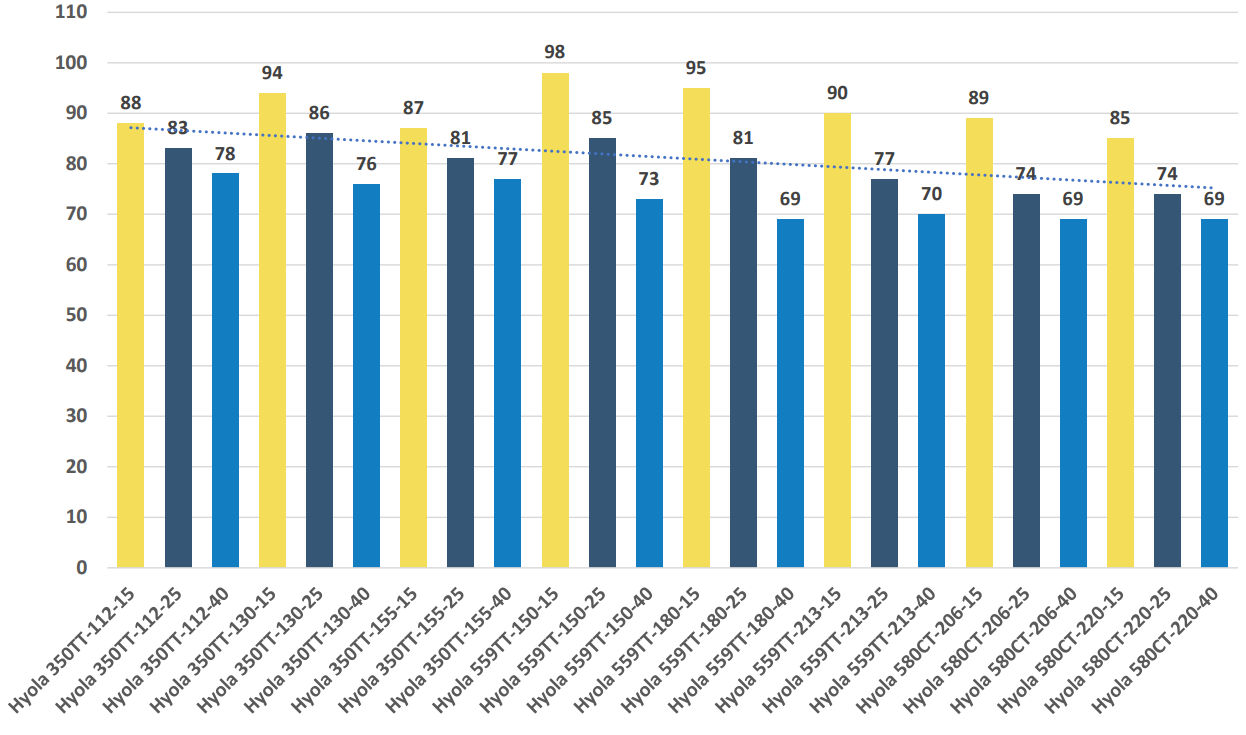
2019 Hyola® TD Plant Population Achieved vs Target Results – RR Technology
Hyola® TT-CT - Mean % of Target Population Achieved across 7 Environments
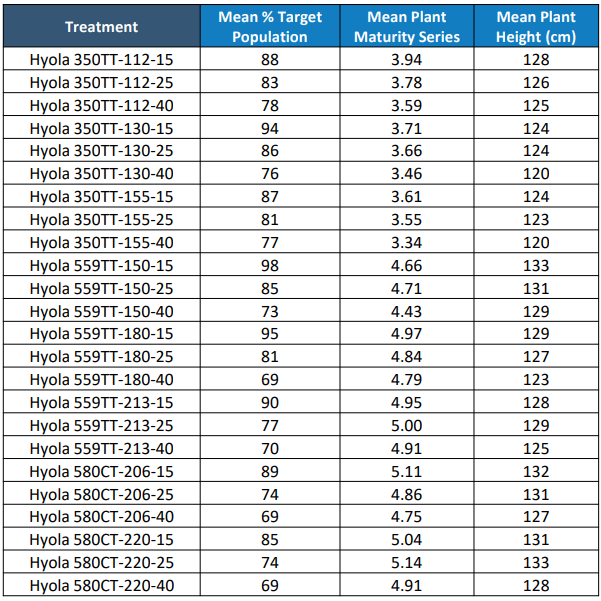
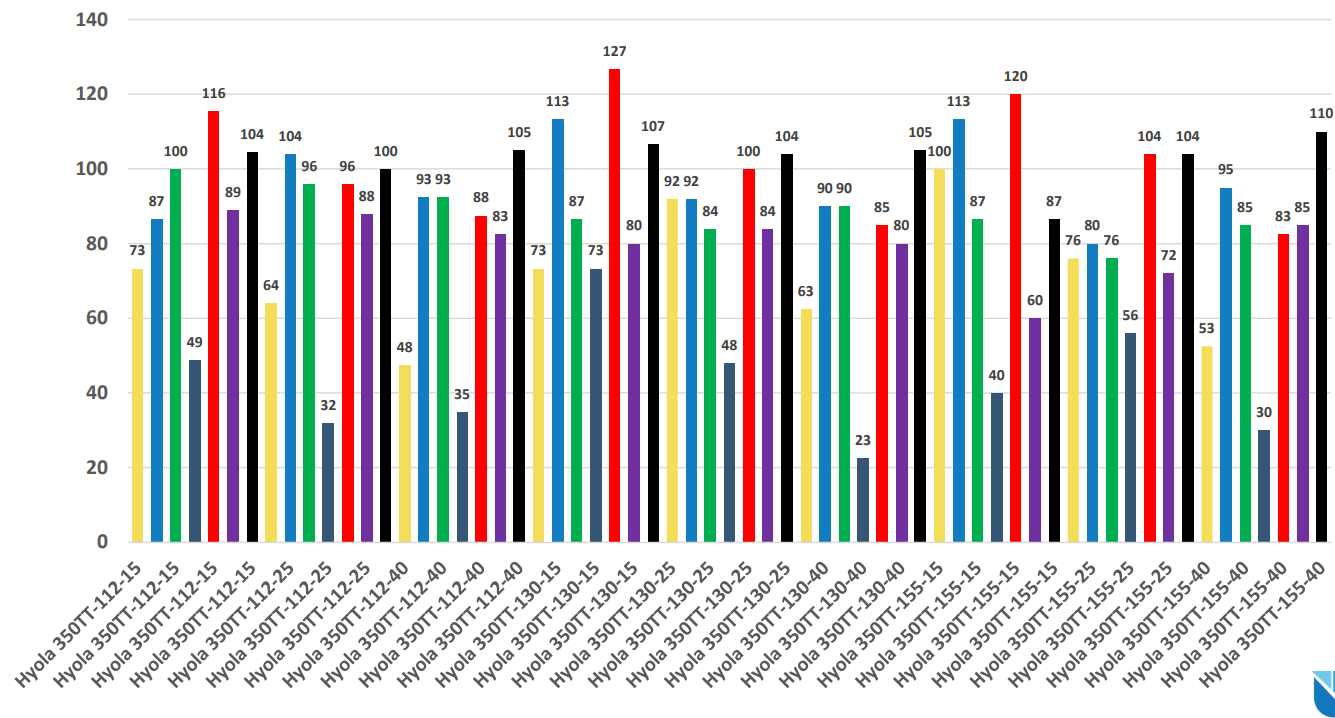
2019 Hyola® TD Plant Population Achieved vs Target Results – TT-CT Technology
Hyola® 350TT - Mean % of Target Population Achieved by Treatment across 7 Environments
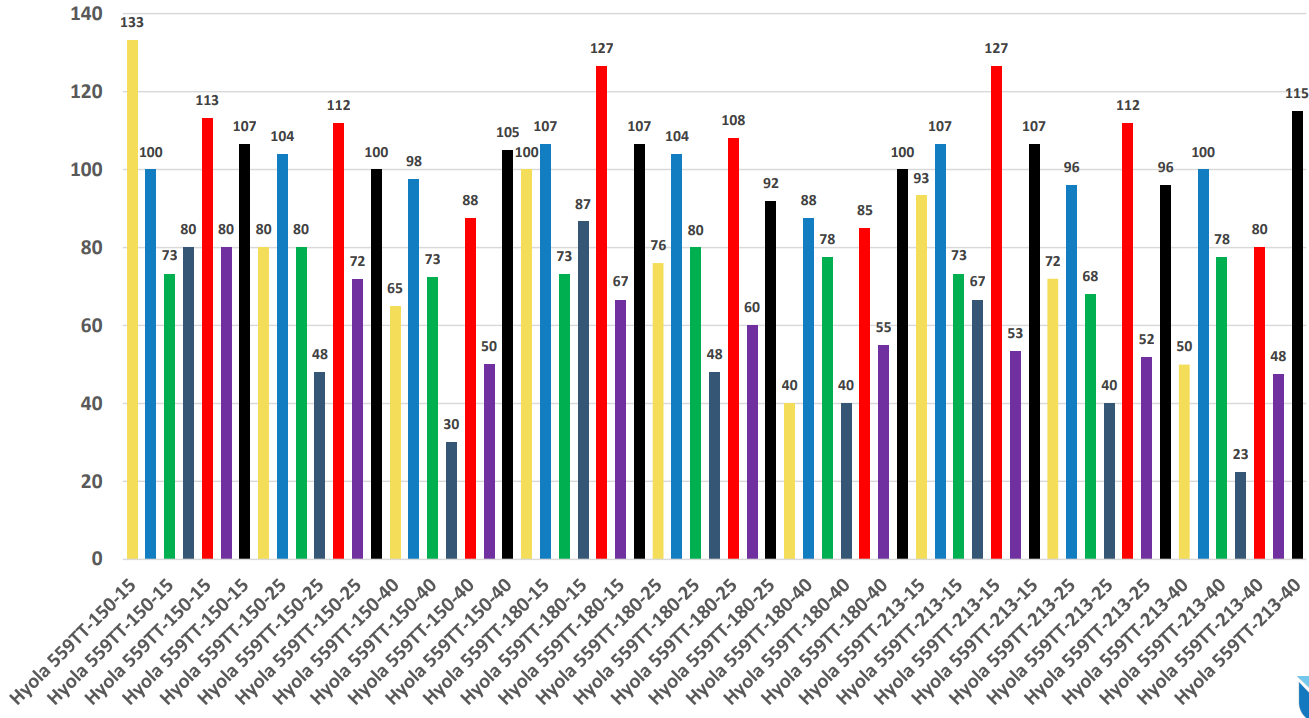
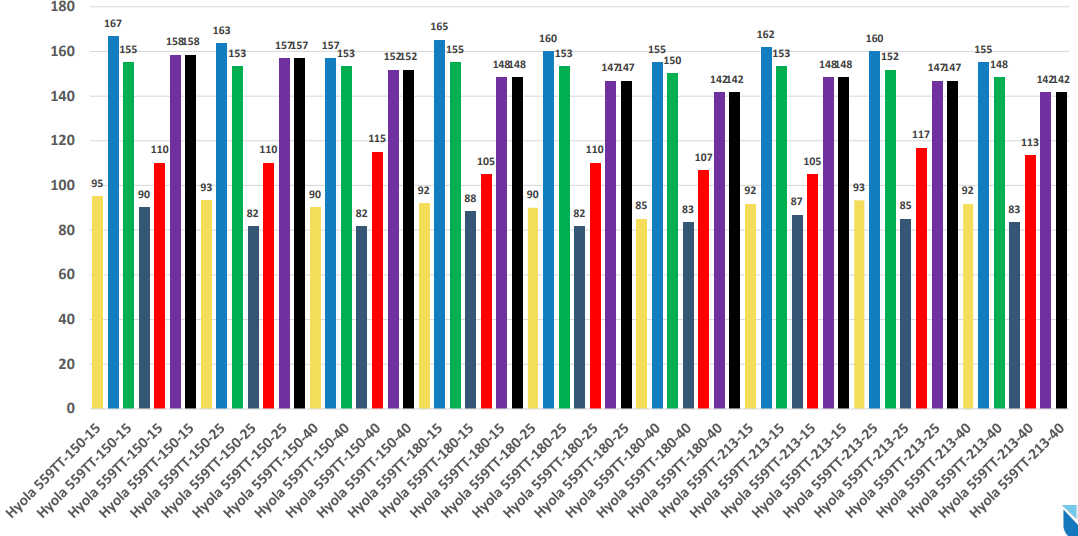
2019 Hyola® TD Plant Population Achieved vs Target Results – TT-CT Technology
Hyola® 559TT - Mean % of Target Population Achieved by Treatment across 7 Environments
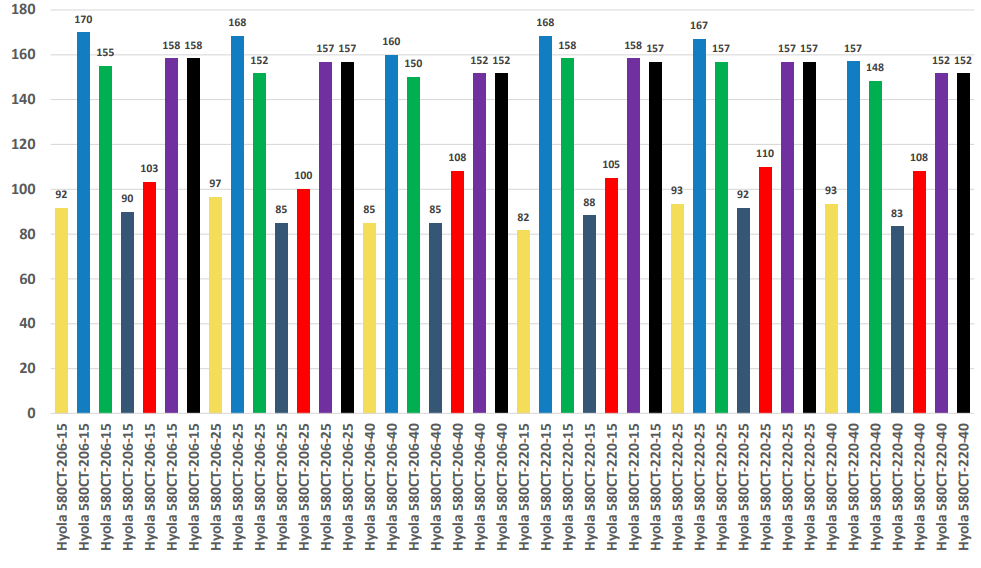
2019 Hyola® TD Plant Population Achieved vs Target Results – TT-CT Technology
Hyola® 580CT - Mean % of Target Population Achieved by Treatment across 7 Environments
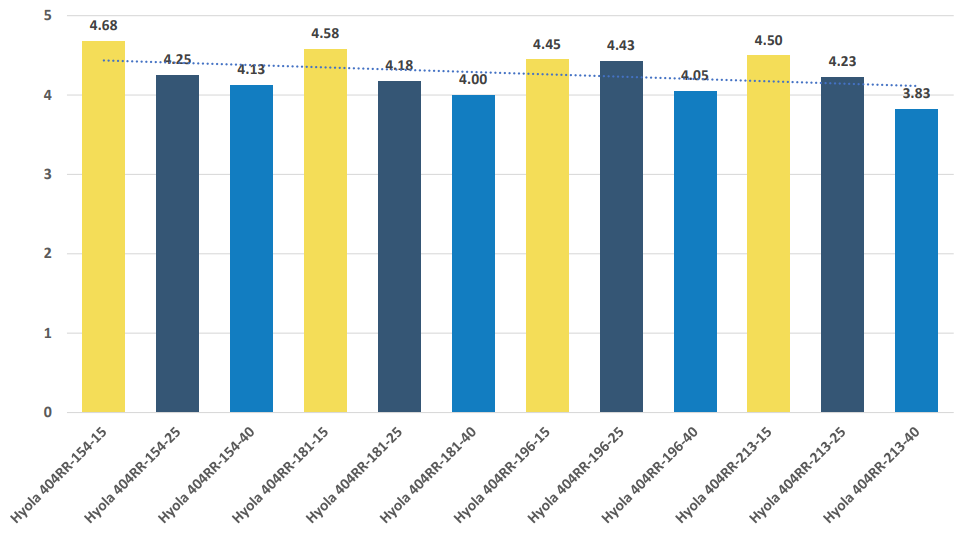
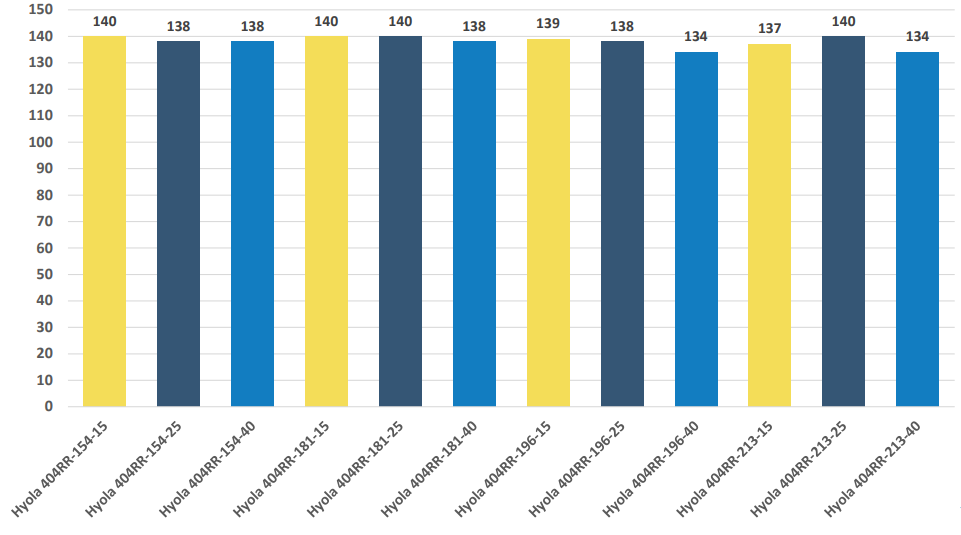
2019 Hyola® TD Windrowing Maturity Series Results – RR Hybrid Technology
Hyola® 404RR - Mean Plant Windrowing Maturity Series across 4 Environments
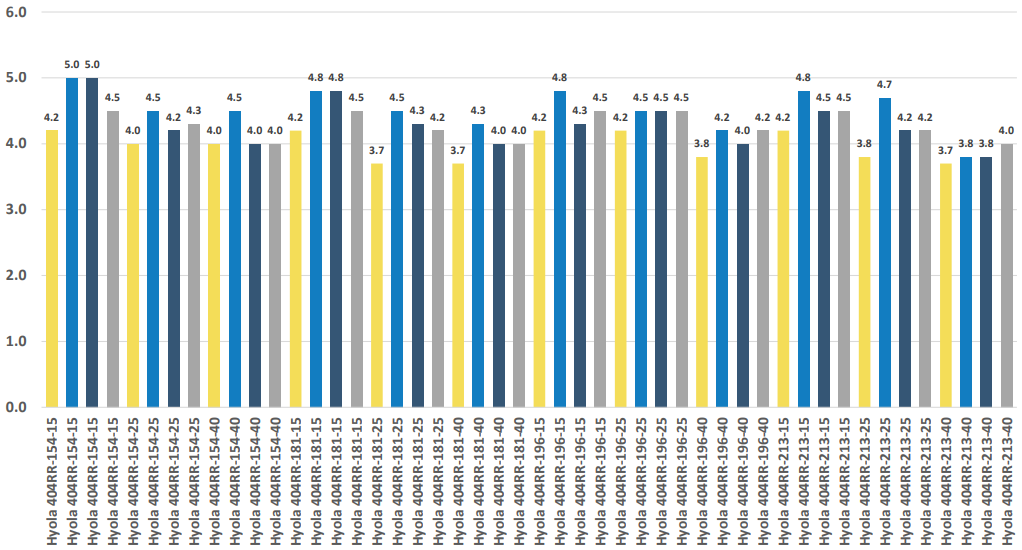
2019 Hyola® TD Windrowing Maturity Series Results – RR Hybrid Technology
Hyola® 404RR - Mean Plant Maturity Windrowing Series by Treatment across each Environment
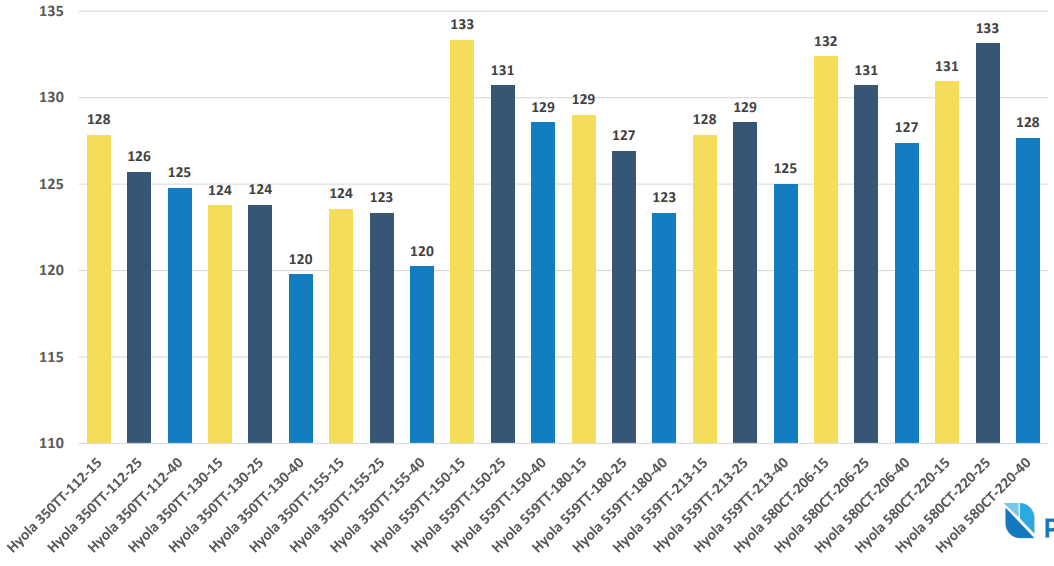
2019 Hyola® TD Windrowing Maturity Series Results – TT-CT Hybrid Technology
Hyola® TT-CT Trials - Mean Maturity (Windrowing Maturity Series) across 7 Environments
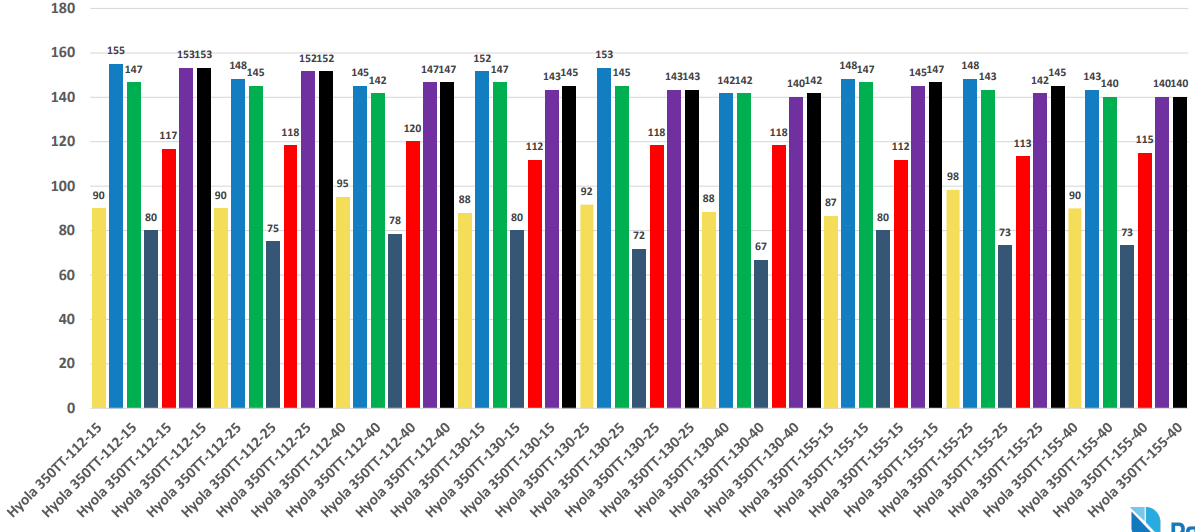
2019 Hyola® TD Windrowing Maturity Series Results – TT-CT Hybrid Technology
Hyola® 350TT - Mean Plant Windrowing Maturity Series by Treatment across 7 Environments
2019 Hyola® TD Windrowing Maturity Series Results – TT-CT Hybrid Technology
Hyola® 559TT - Mean Plant Windrowing Maturity Series by Treatment across 7 Environments
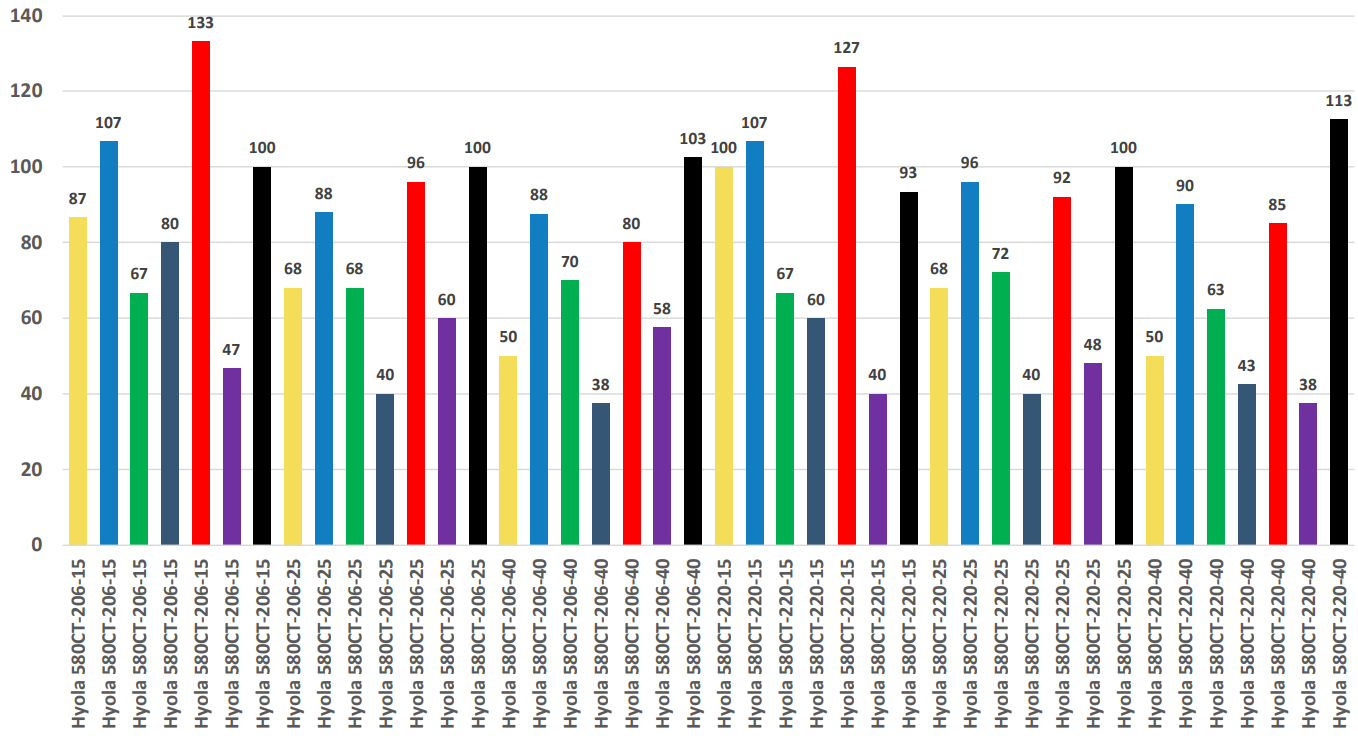
2019 Hyola® TD Windrowing Maturity Series Results – TT-CT Hybrid Technology
Hyola® 580CT - Mean Plant Windrowing Maturity Series by Treatment across 7 Environments
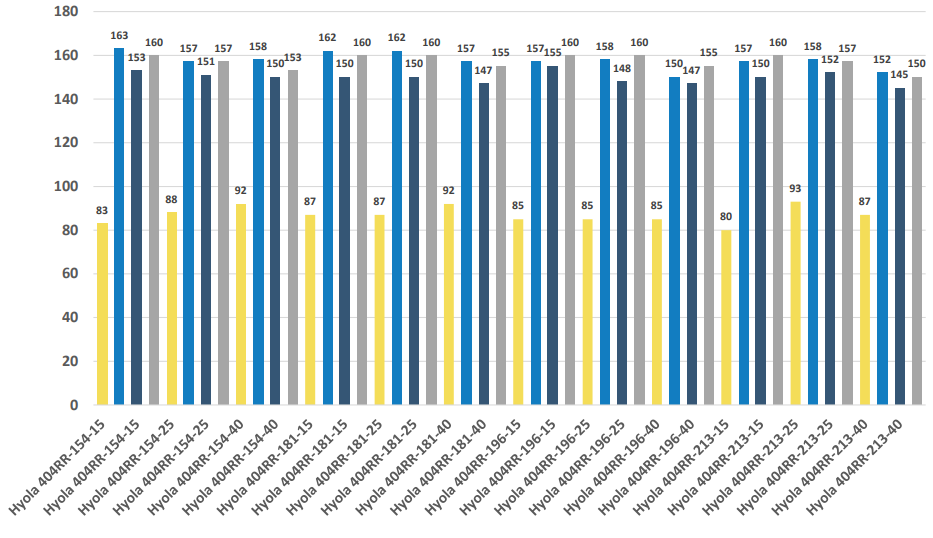
2019 Hyola® TD Plant Height (cm) Results – RR Hybrid Technology
Hyola® 404RR - Mean Plant Height (cm) across 4 Environments
2019 Hyola® TD Plant Height (cm) Results – RR Hybrid Technology
Hyola® 404RR - Mean Plant Height (cm) by Treatment across each Environment
2019 Hyola® TD Plant Height (cm) Results – TT-CT Hybrid Technology
2019 Hyola® TT-CT Trials - Mean Plant Height (cm) across 7 Environments
2019 Hyola® TD Plant Height (cm) Results – TT-CT Hybrid Technology
Hyola® 350TT - Mean Plant Height (cm) by Treatment across 7 Environments
2019 Hyola® TD Plant Height (cm) Results – TT-CT Hybrid Technology
Hyola® 559TT - Mean Plant Height (cm) by Treatment across 7 Environments
2019 Hyola® TD Plant Height (cm) Results – TT-CT Hybrid Technology
Hyola® 580CT - Mean Plant Height (cm) by Treatment across 7 Environments
2019 Hyola® TD Analysed Grain Yield (t/ha) Results – RR Hybrid Technology
2019 Kojonup WA TT-CT Trial Environment
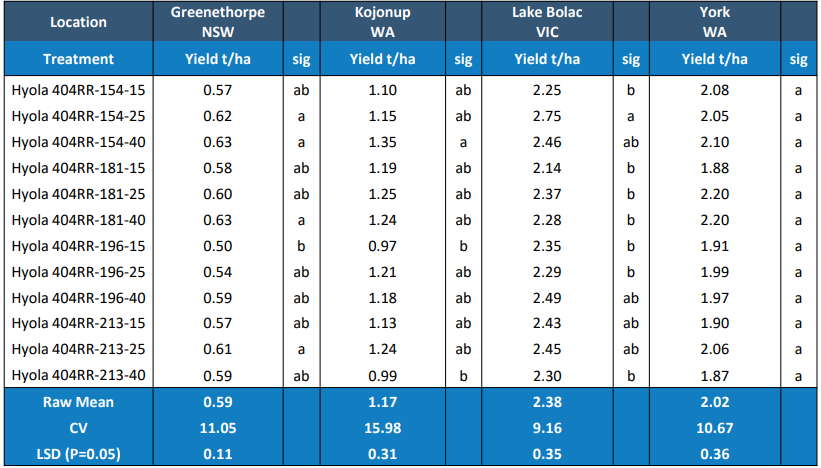
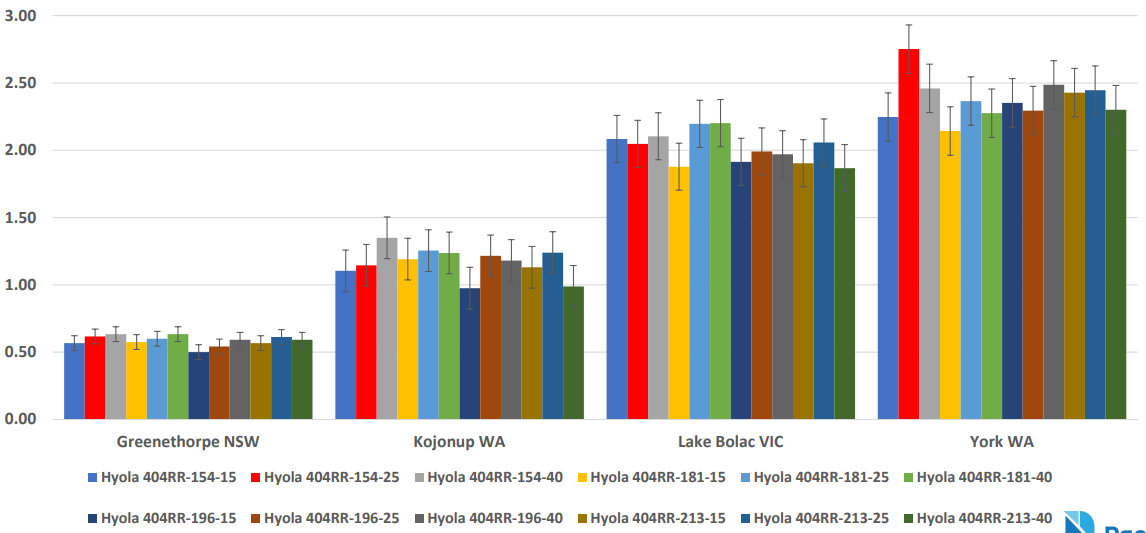
2019 Hyola® TD Analysed Grain Yield (t/ha) Results – RR Hybrid Technology
2019 Hyola 404RR - Analysed Grain Yield (t/ha) by Location by Seed Size by Target Population
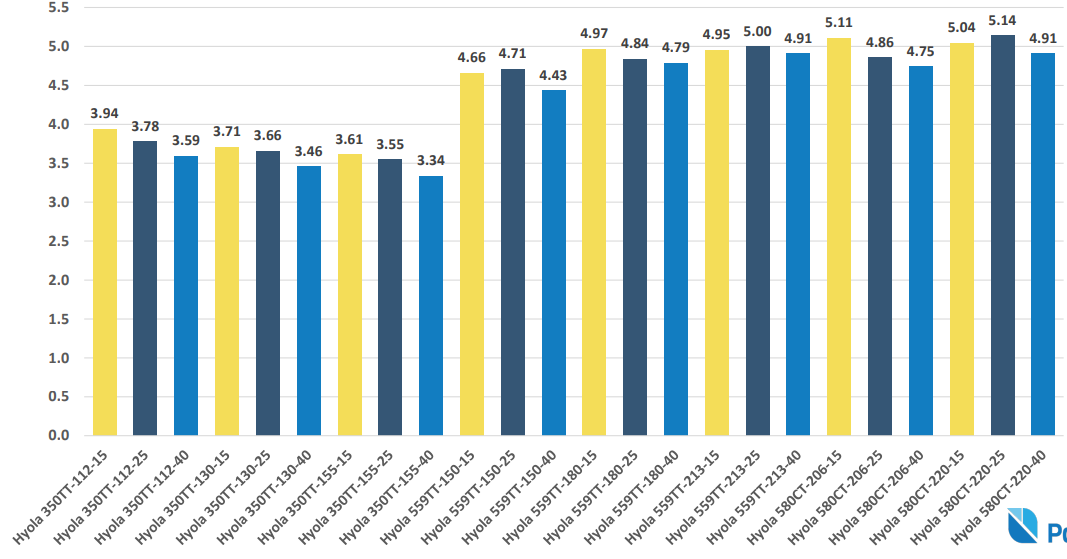
2019 Hyola® TD Analysed Grain Yield (t/ha) Results – TT-CT Hybrids – Western Australia
2019 Gnowangerup WA TT-CT Trial Environment
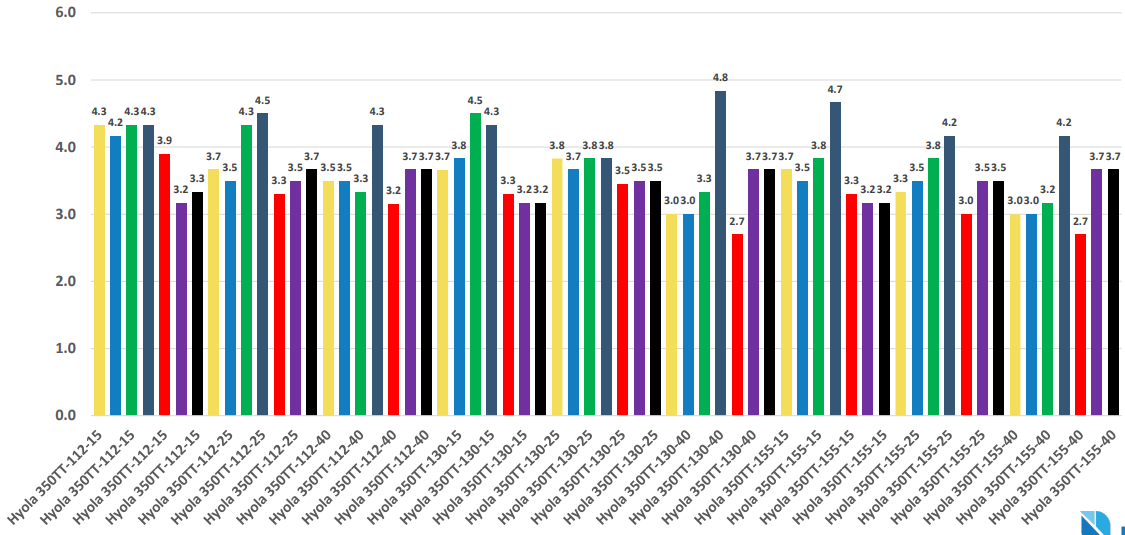
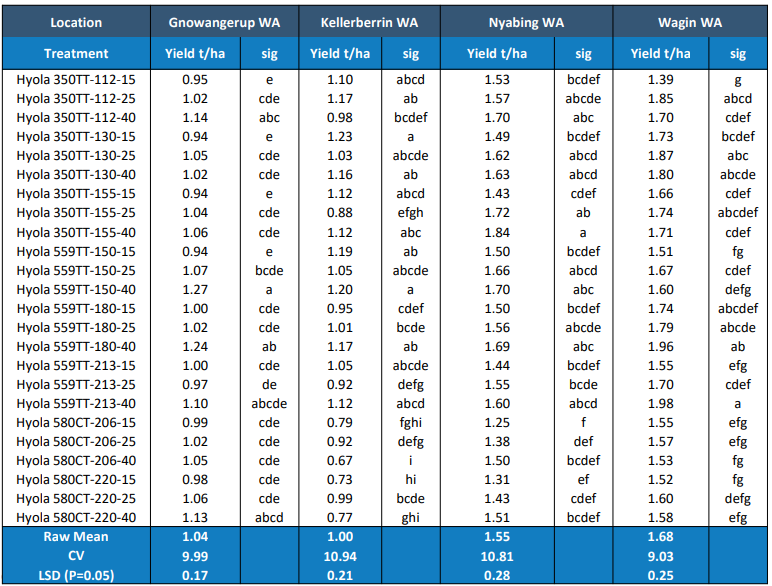
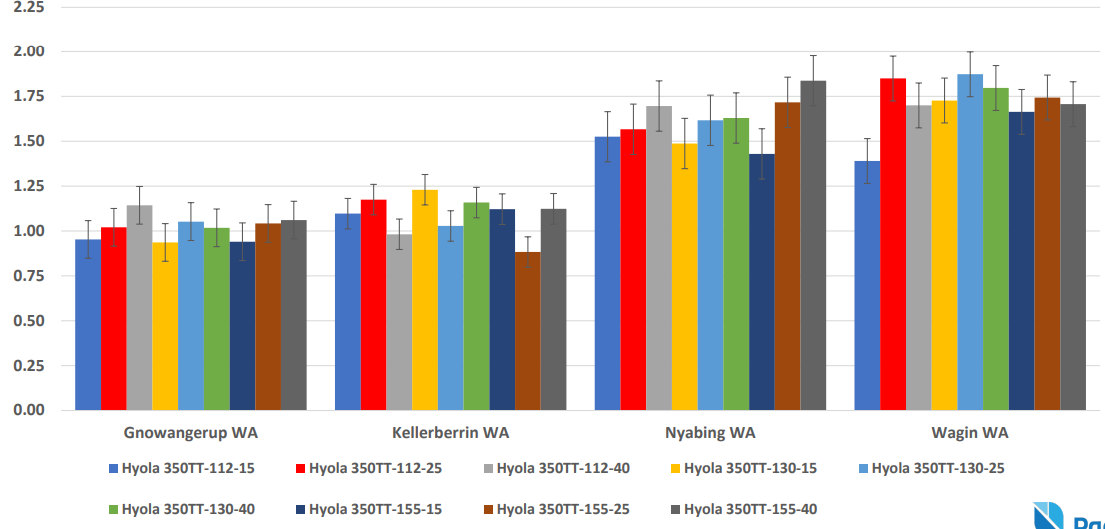
2019 Hyola® TD Analysed Grain Yield (t/ha) Results – TT-CT Hybrids – Western Australia
2019 Hyola 350TT - Analysed Grain Yield (t/ha) by WA Location by Seed Size by Target Population
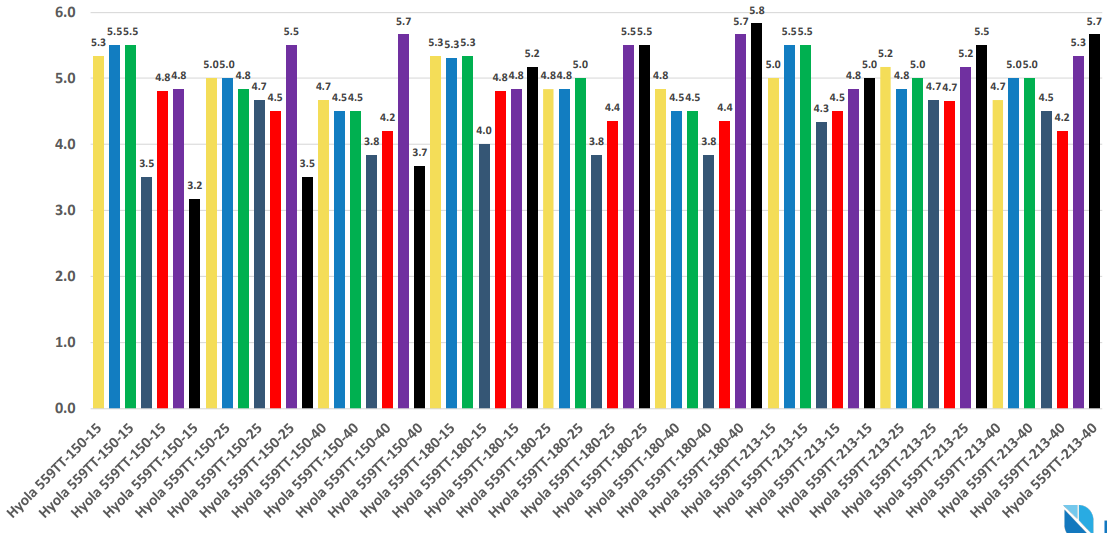
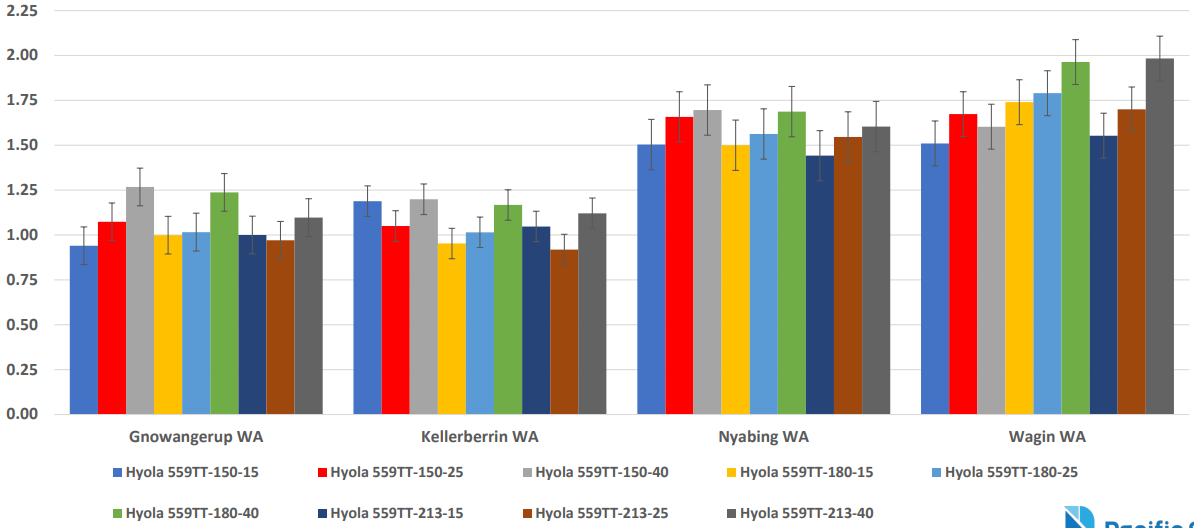
2019 Hyola® TD Analysed Grain Yield (t/ha) Results – TT-CT Hybrids – Western Australia
2019 Hyola 559TT - Analysed Grain Yield (t/ha) by WA Location by Seed Size by Target Population
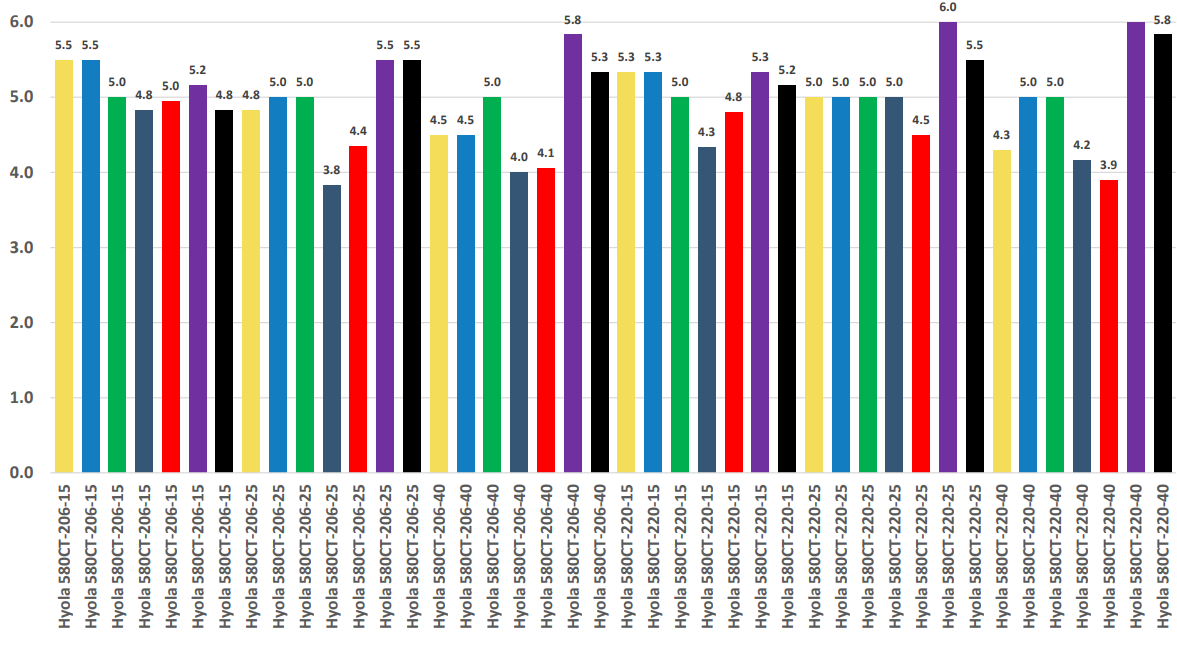
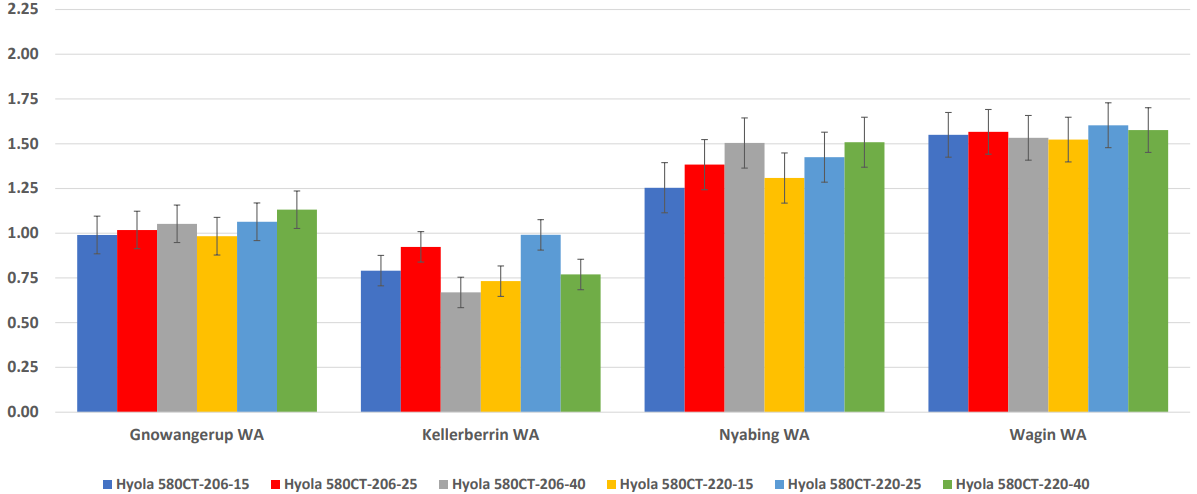
2019 Hyola® TD Analysed Grain Yield (t/ha) Results – TT-CT Hybrids – Western Australia
2019 Hyola 580CT - Analysed Grain Yield (t/ha) by WA Location by Seed Size by Target Population
2019 Hyola® TD Analysed Grain Yield (t/ha) Results – TT-CT Hybrids – Eastern Australia
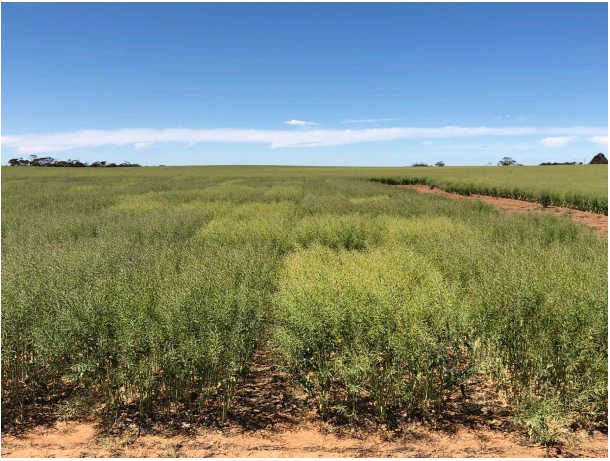
2019 Beulah Vic TT-CT Trial Environment
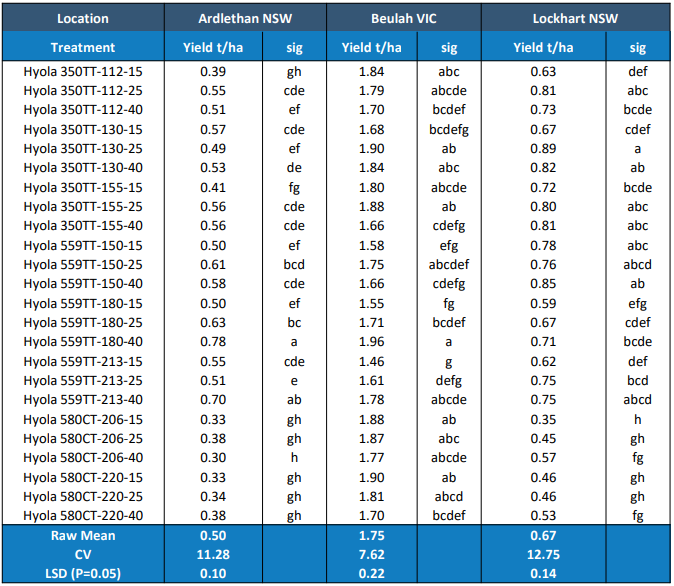
2019 Hyola® TD Analysed Grain Yield (t/ha) Results – TT-CT Hybrids – Eastern Australia
2019 Hyola 350TT - Analysed Grain Yield (t/ha) by EAST AUST Location by Seed Size by Target Population
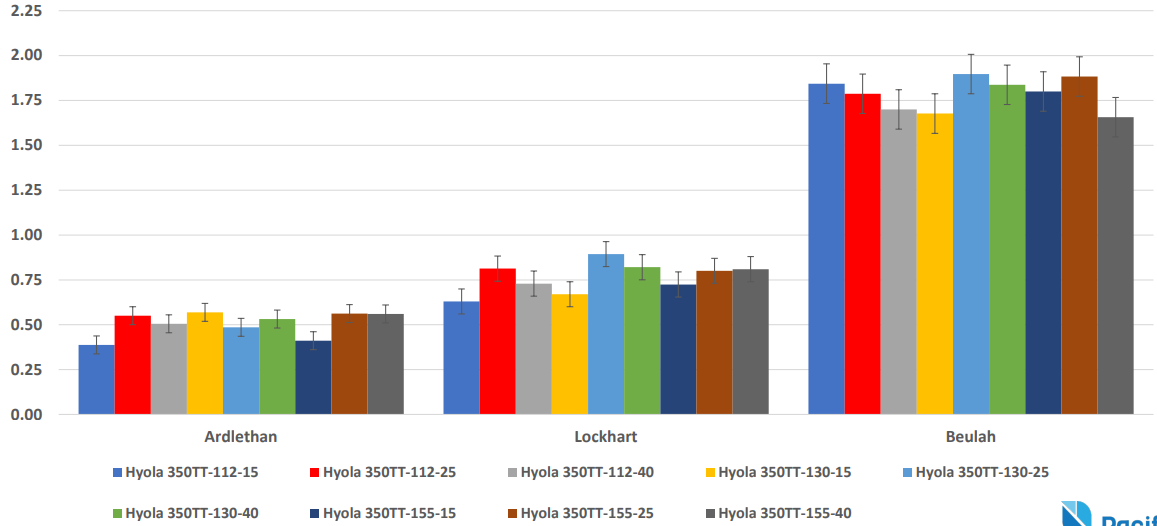
2019 Hyola® TD Analysed Grain Yield (t/ha) Results – TT-CT Hybrids – Eastern Australia
2019 Hyola 559TT - Analysed Grain Yield (t/ha) by EAST AUST Location by Seed Size by Target Population
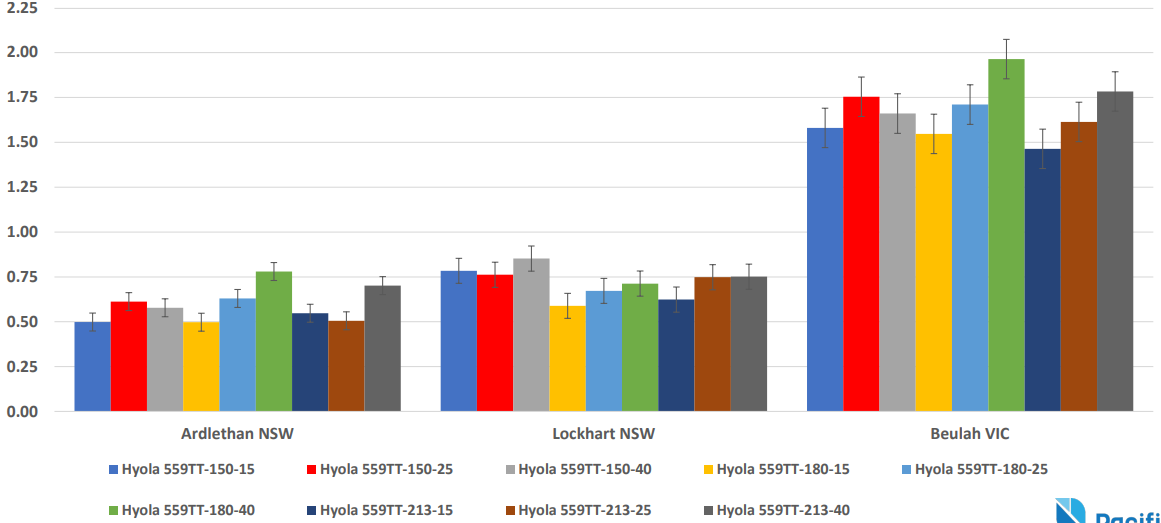
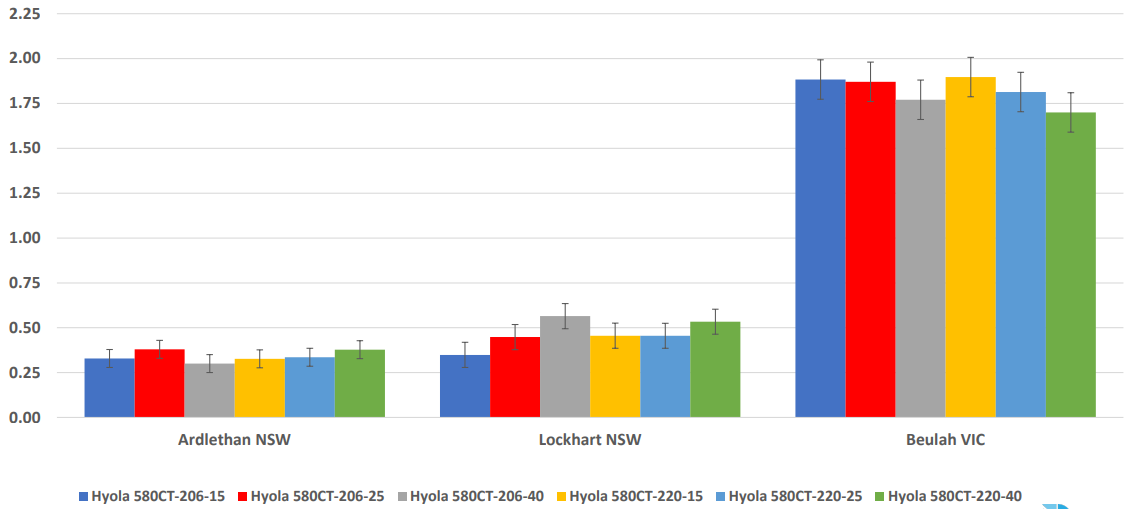
2019 Hyola® TD Analysed Grain Yield (t/ha) Results – TT-CT Hybrids – Eastern Australia
2019 Hyola 580CT - Analysed Grain Yield (t/ha) by EAST AUST Location by Seed Size by Target Population
2019 Hyola® TD - Canola Plant Population by Seed Size Trials Summary
- Yield responses across the 11 trial environments varied between varieties, seed sizes and plant population targets.
- Previous research studies - mixed outcomes relating to the effect of seed size and plant densities on grain yield
- Seed size, yield benefit from larger canola seed was observed by Elliot et al (2008) and Brill et al (2016),
- Harker et al (2015), Clayton et al (2009), and Lamb and Johnson (2004) did not measure a benefit of larger seed on canola yield
2019 Hyola® TD - Canola Plant Population by Seed Size Trials Summary
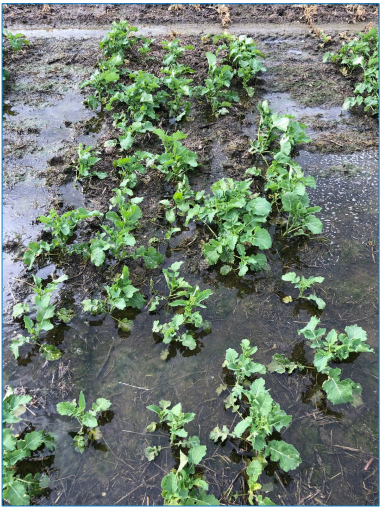
Seed size can impact the percentage of plants both emerged and established to varying levels in different environments
Larger seed has been found to provide higher observed biomass accumulation and % establishment in some environments
Larger seed at lower plant populations leads to final plant maturity being delayed.
2019 Kojonup WA - RR Trial Environment
2019 Hyola® TD - Canola Plant Population by Seed Size Trials Summary
Higher plant populations irrespective of seed size and variety genetics often showed observed earlier maturity and sometimes
decreased plant height
(G) X (E) interactions often override (M) management decisions based around seed size and population targets on the resultant
grain yields.
2019 York WA - RR Trial Environment
2020 Hyola® TD - Research Trials Project Outline
- Pacific Seeds will continue this important industry research by focusing the evaluation on the relationships between TT and CT hybrids vs 3 OP TT varieties (farmer prepared retained samples)
- Evaluations of various plant populations and seed sizes across 10 Australian Environments
- Determining any ‘potential’ grain yield and gross return $/ha value of grading OP TT varieties to larger seed sizes and planting at higher rates versus TT and CT hybrids.