Download The


Agronomic and value equation outcomes associated with a matrix of different canola seed sizes by plant populations by seeding depth.
Andrew Heinrich and Willow Liddle, Pacific Seeds, Perth, and Toowoomba.
Key Words
Canola hybrids, seeding depth, seed size, plant populations, maximising grower returns, exploring value equations
Key messages
1. The larger seed size combined with normal sowing depth and the higher plant population target provided higher effective plant establishment, harvested grain yields and the best value equations.
2. Mid-sized hybrid seed sown at the higher population target whether sown at the normal or deep levels, provided competitive establishment and grain yields.
3. The smallest seed size only provided moderately competitive yields at normal sowing depth and the higher plant population target.
4. The relative flowering maturity showed the trend of slowing down (later maturing) with the lower plant population target, especially for the smaller seed size at both normal and deep sowing levels.
Aims
This research examines the environmental differences in canola plant establishment, flowering maturity, grain yield, oil % and economic returns when using one canola hybrid comparing a matrix of different canola seed sizes by plant populations by seeding depths.
Introduction
Australian canola growers and agricultural advisors have been seeking increased scientific information and recommendations on seed size by plant population by seeding depth relationships in hybrid canola and its impact on plant establishment, grain yield, and resulting gross income.
The cost of purchasing F1 hybrid seed each year has some Australian growers and advisers strategically lowering seeding rates and effective plant populations to minimise input costs whilst aiming to maximise returns.
French et al. (2016) reported that field establishment in spring canola under Western Australian conditions ranges from 0.3 -1.0 of the target population, with a median value of 0.855 for the target population of 40 plants/m2. This new research was conducted across all the key Australian canola-growing regions. Replicated field trials were planted in various environmental conditions, representing a wide range of sowing dates, seasonal temperatures, rainfall, and soil types.
Brill et al. (2013) showed that planting canola deeper than 2.5 cm reduced overall establishment in 2012; however, grain yield was generally affected to a smaller degree. Where planting into moisture below the optimum seeding depth (>2.5 cm), use large seed (minimum 5 g per 1000 seeds), avoid high rates of fertiliser in direct contact with the seed and avoid high stubble loads.
Brill et al. (2014) also demonstrated that growers should aim to sow large (>5 g/1000 seeds) canola seed to achieve adequate establishment rates from early sowing. Hybrid vigour (heterosis) has an indirect effect (larger seed size) and a direct effect (enhanced vigour) on canola establishment.
Fletcher et al. (2024) determined that deep sowing decreased plant emergence by an average of 41%, confirming previous studies suggesting a decline in emergence at depths below 25mm with current canola genetics.
Method
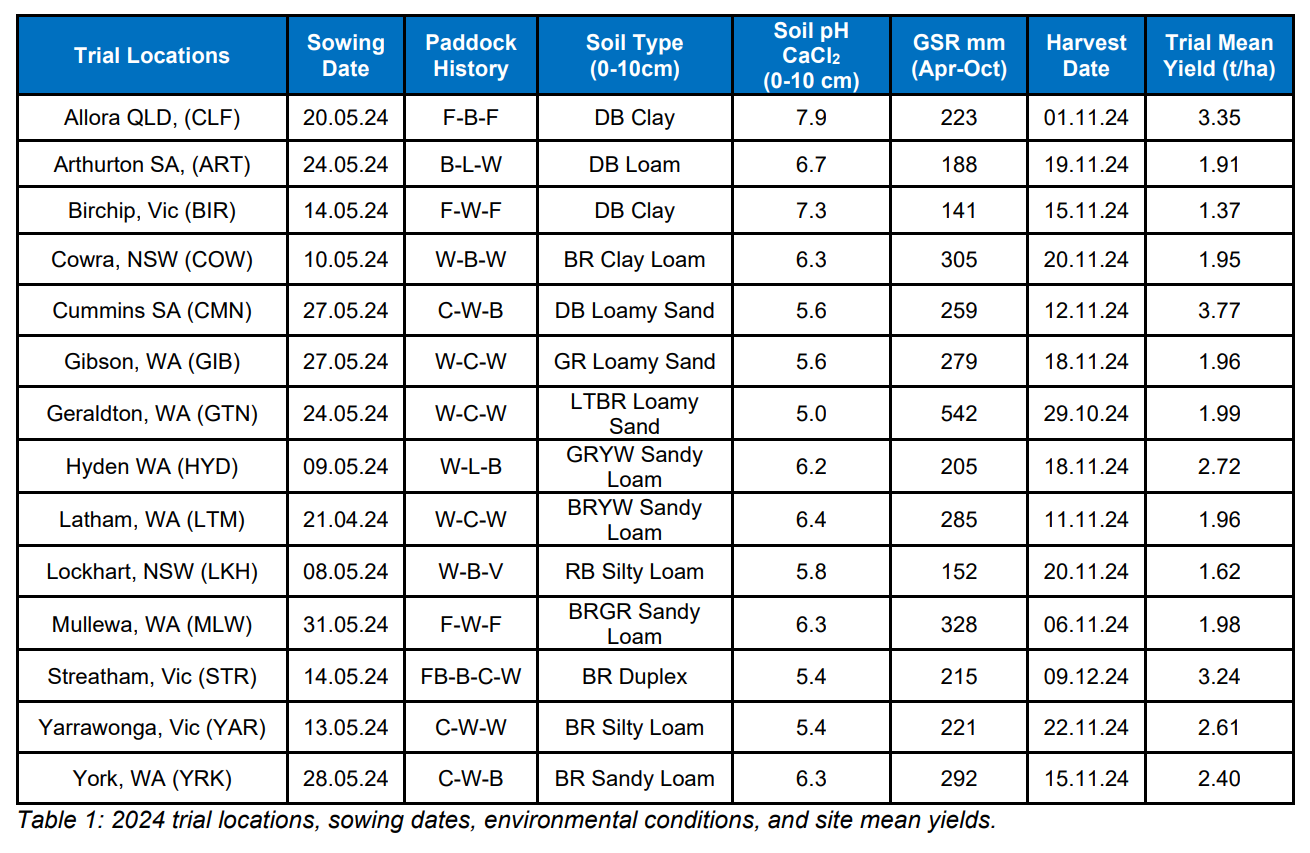
17 Pacific Seeds Hyola® Innovation Systems Trials were established with this specific research across Australia, representing a diverse range of environments within the canola-growing regions in 2024. 14 sites were retained for harvest and data analysis, as 3 sites were not harvested due to the trials having unacceptable agronomic integrity.
The 14 trial environments had a wide range of differences relating to sowing timing, seasonal rainfall, cropping histories, soil types and soil pH, with a combination of Best Management Practice (BMP) and District Standard Practice (DSP) treatments applied per each location aimed at maximising potential yields for the treatments present, thus enabling a diverse set of data collection for accurate comparisons.
The trials were mostly sown at later dates than normally expected for canola production, due to the later than usual seasonal opening rainfall breaks across Australia and these later emergence timings may have had an influence on effective plant establishment and GDD driven plant biomass growth and subsequent grain yields.
Treatments and Trial agronomic details The seeding depth by population by seed size matrix of treatments were embedded within the unique Hyola Innovations Systems technology trial design. These trials are based upon RCB spatial designs (2 reps, 12 ranges), with one hybrid variety Hyola Defender CT having a treatment matrix of 3 size variables (165,000, 195,000, 222,000 seeds per kg), 2 populations variables of 20 and 40 plants per m2 targets and 2 seeding depths of 10-20mm and 30-40mm.
Hyola Defender CT had the full registered label rate of appropriate herbicides applied at the optimum timing as per the inherent herbicide tolerances. (no CL applied as was in the TT Block)
The two plant densities targeted at sowing for specific treatments were 20 and 40 plants per square meter and adjusted by sowing a set number of seeds per plot, using 90% germination and a 75% establishment factorial. The F1 hybrid Hyola Defender CT seed used for all size and depth treatments were hybrid seedlots produced in 2023. Seeding depth was monitored for all sites with measurements taken for all normal vs deep sowing operations.
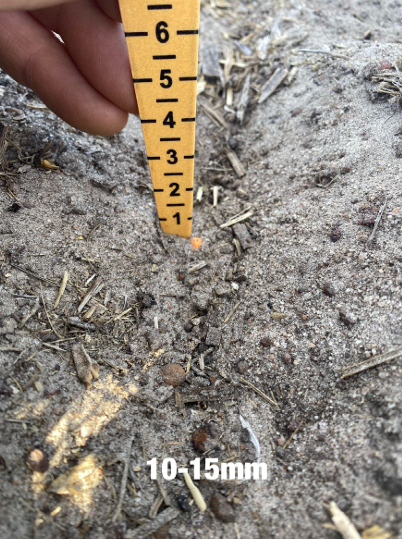
Image 1a: Gibson WA 10-15mm sowing depth treatment
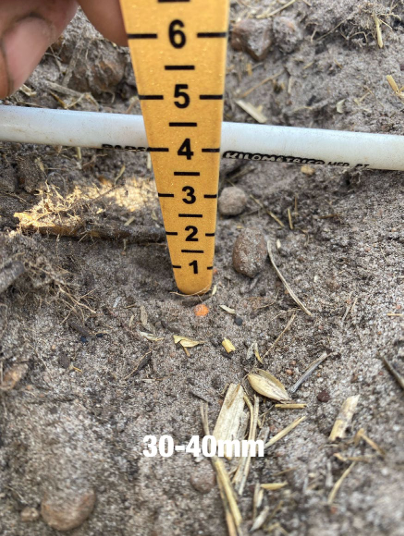
Image 1b: Gibson WA 30-40mm sowing depth treatment

Images 1c-1f: Cummins SA, York WA, Arthurton SA, and Yarrawonga Vic sowing depth treatments per trial.
Plant establishment counts at each location were conducted at the 3-5 leaf stage (BBCH 13-16) by counting 3*1m or 4*1m rows per plot or whole plots to establish plants per meter square.
Grain yields were measured on each treatment by small plot harvesters. Grain oil percentage content was measured using standard calibrated NIR.
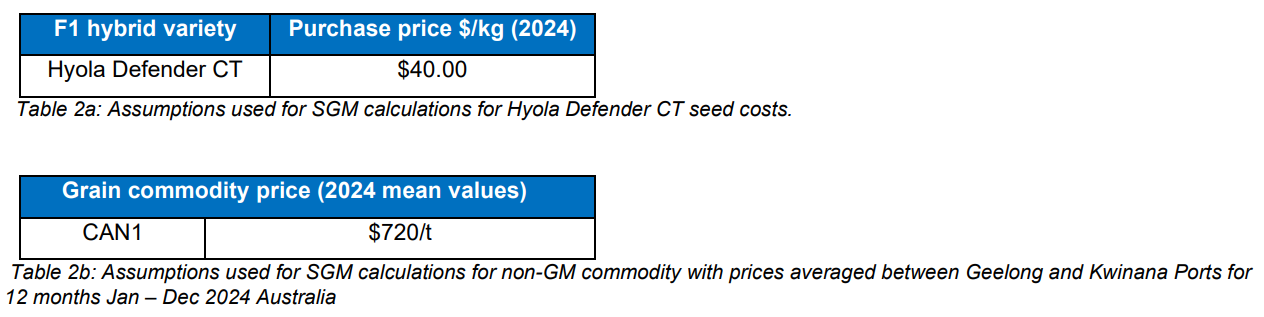
A “simplified” Gross Margin (SGM) was calculated as, SGM = Grain yield * grain price – estimated seed cost.
These values were used in this research as each environment will have differing input costs relative to the expected grain yield, but within each environment, the input costs for fertiliser, herbicides, etc. are assumed to be equal, irrespective of the treatment applied. Assumptions for the value of seed and harvested grain pricing are shown in Tables 2 a-b.
Establishment, maturity, yield and oil analysis for single sites were performed fitting variety, row and column as fixed linear factors and spatial adjustments were performed using the auto-regressive model hence giving a blup output with standard error for each site. Statistical reference: Using ASReml (Butler et al., 2023).
In addition, Establishment, maturity, yield and oil were further investigated using single step factor analytic Multiple Environment Trial (MET) analysis with ASReml in a model with generation as a linear fixed factor with composite variety as a random factor hence giving a blup for each site. Spatial adjustments were determined using the auto-regressive model. Statistical reference: Using ASReml (Butler et al., 2023).
Results and discussion
Plant establishment
With respect to plant establishment, French et al. (2016) showed that canola field establishment varied from 0.3 to 1 and was higher at low target density with a median of 0.585 at a target density of 40 plant/m2. This research achieved a mean establishment of 0.62 for the target population density of 40 plants/m2 across all treatments. These trials experienced a range of highly variable establishment conditions which showed a range between 46-91% of the target populations.
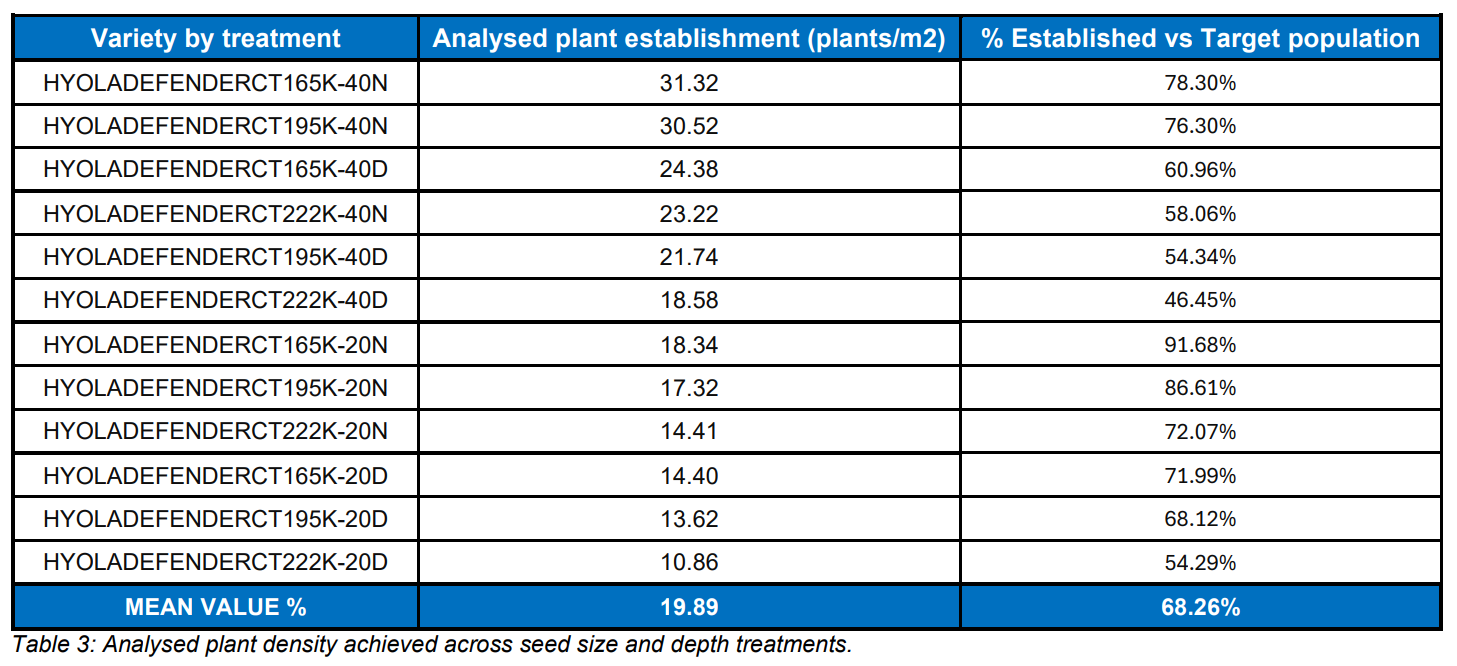
The Deeper sowing treatments (30-40mm) decreased establishment by 30% on average across the different seed size treatments compared to the Normal sowing depth of 10 – 20 mm treatments. The mean of the 40 plants per m2 treatments across the 3 seed sizes was 168% of the mean of 20 plants per m2 treatments.
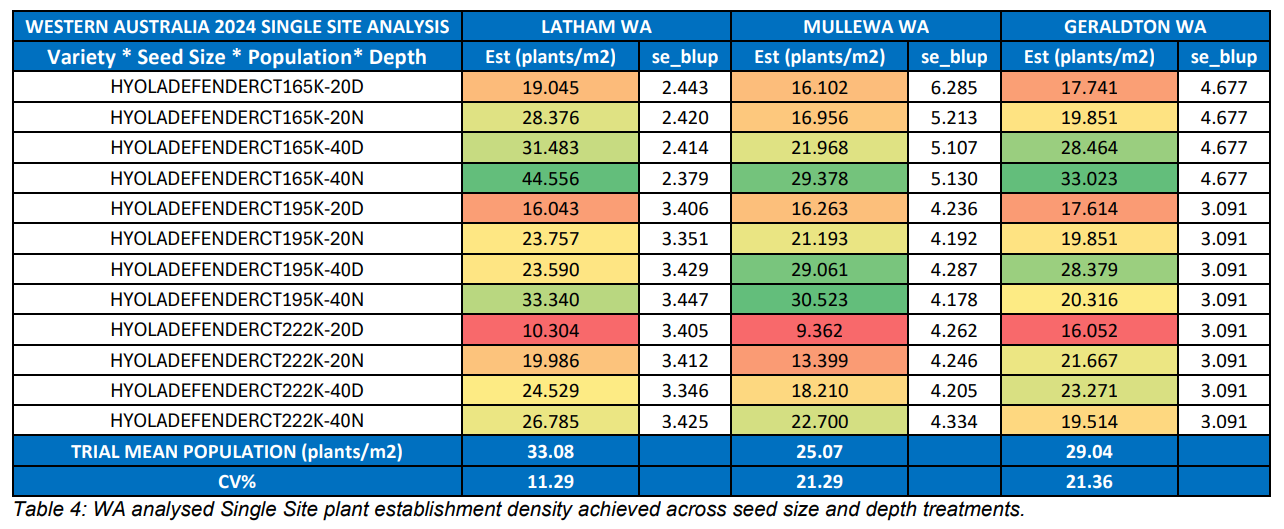
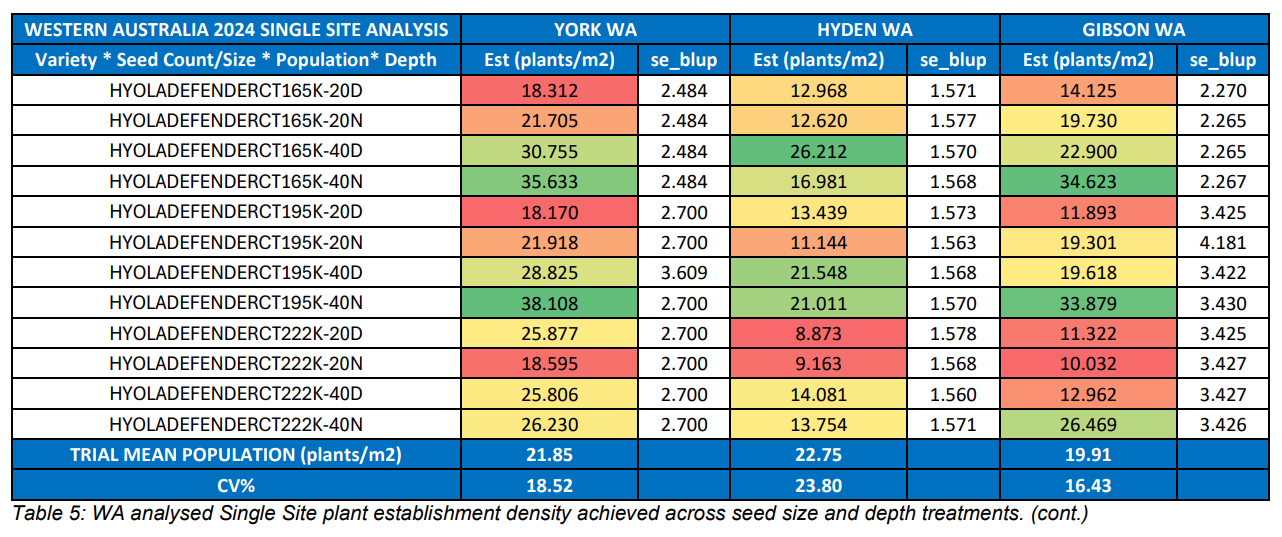
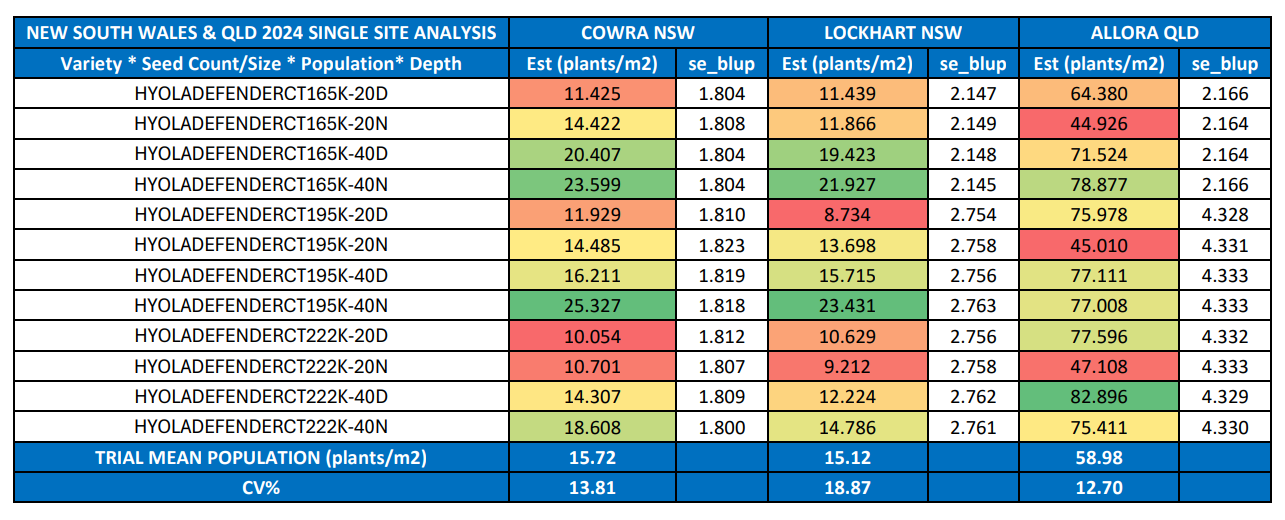
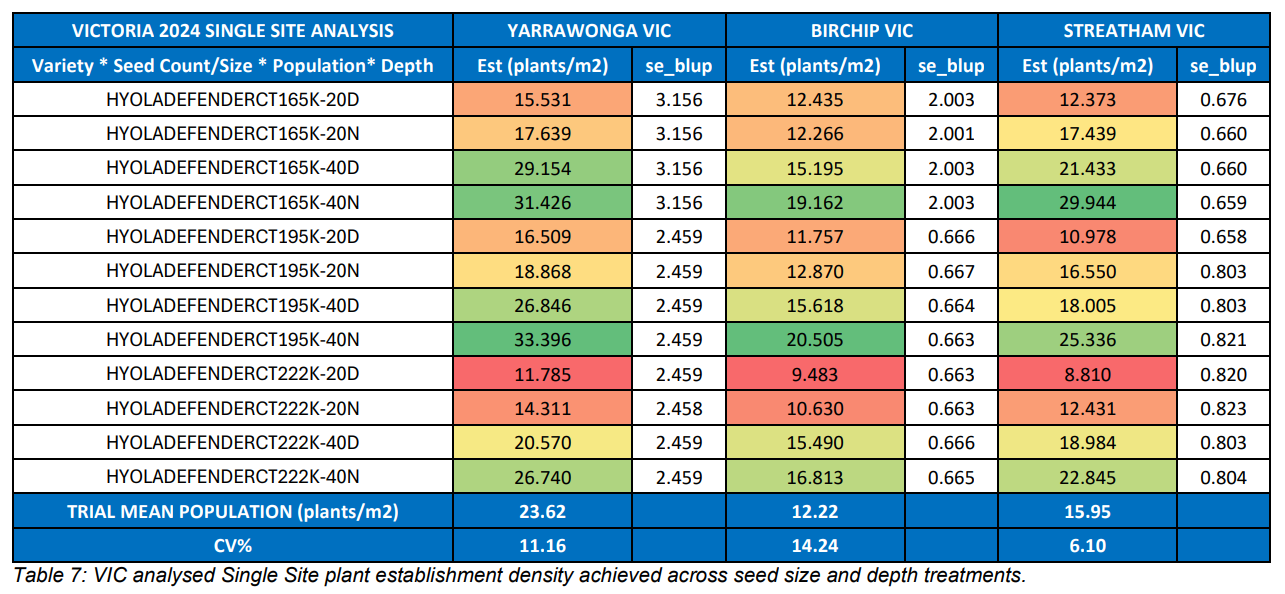
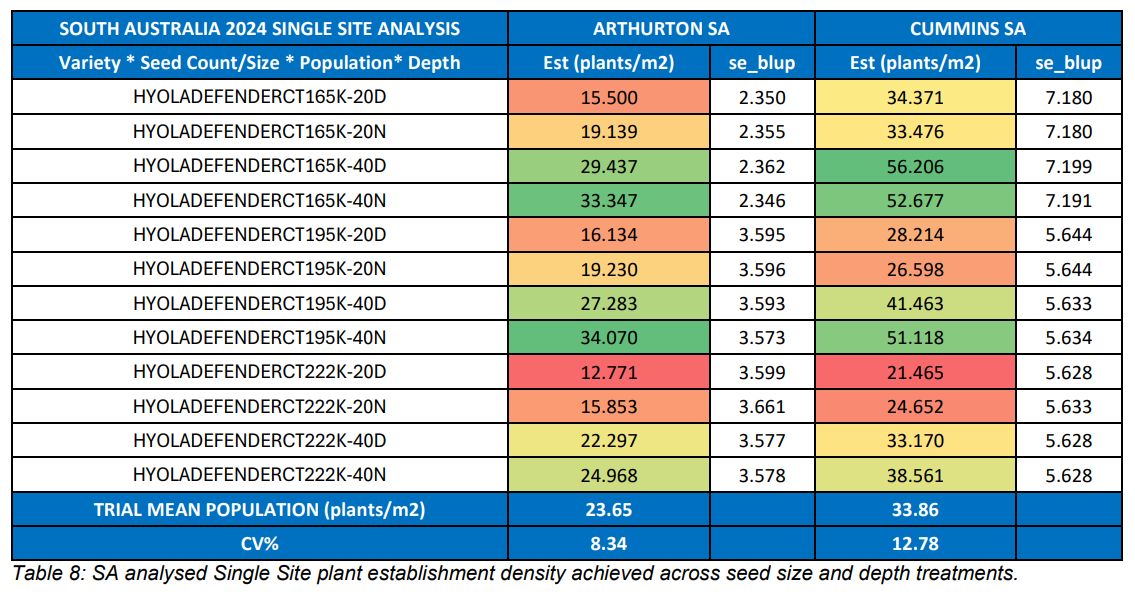
Table 6: NSW/QLD analysed Single Site plant establishment density achieved across seed size and depth treatments.
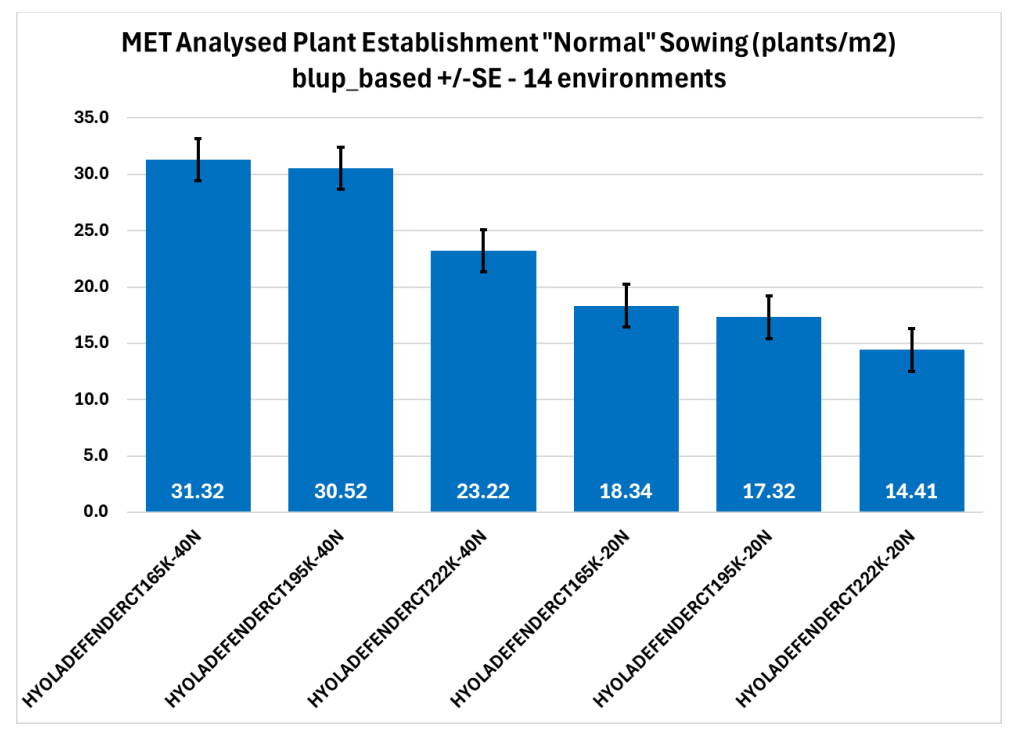
Graph 1: MET analysed established plant density by seed size, Normal seed depth and population targets (Mean + SE, p<0.05)
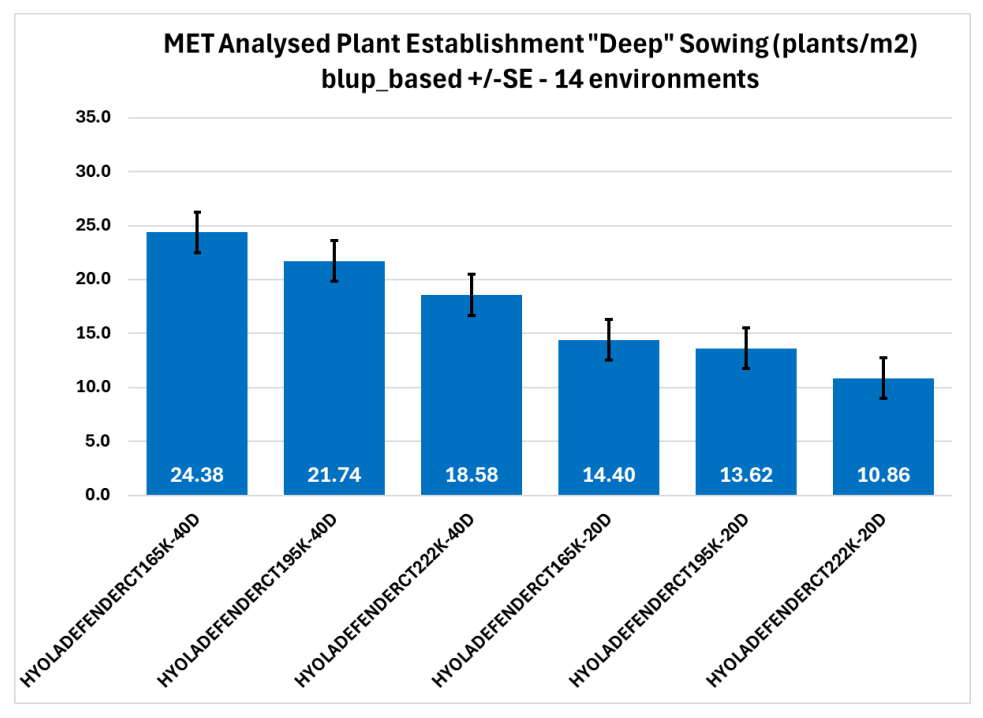
Graph 2: MET analysed established plant density by seed size, Deep sowing depth and population targets (Mean + SE, p<0.05).
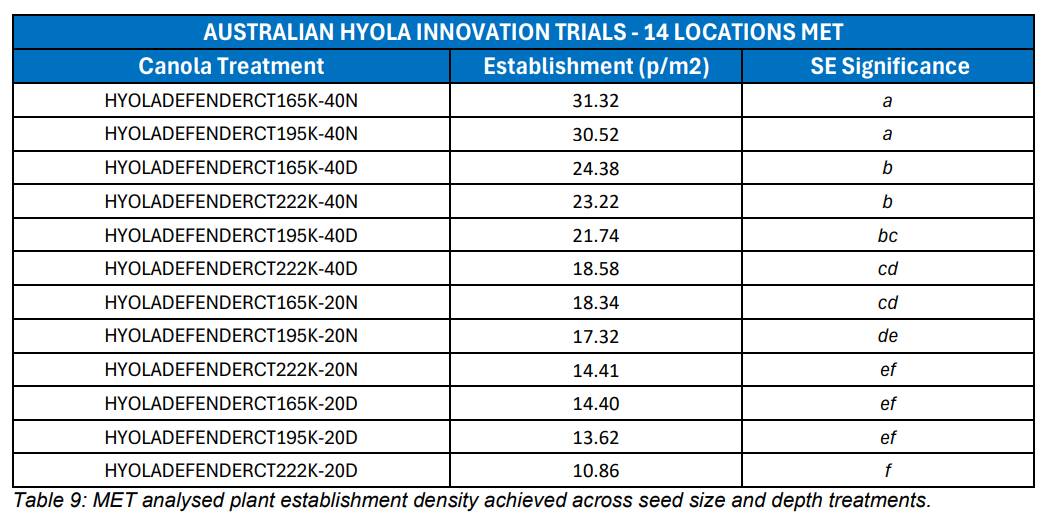
Established plant density for the larger seed size of 165,000 seeds per kg (>2mm) (do we have these seed sizes) sown at normal depth showed some significantly greater (p<0.05) responses compared to mid-size 195,000 seeds per kg (=2mm) and the small size 222,000 seeds per kg (<2mm) treatments.
The 165,000 seeds per kg larger seed with a population target of 20 plants per m2 sown at normal depth treatment showed plant counts not significantly different to 222,000 seeds per kg smaller seed sown at depth targeting 40m plants per m2 treatment. This result demonstrates the additional hybrid vigour associated with larger seed vs smaller seed and the associated influence of seeding depth.
There was no significant difference between 165,000 seeds per kg and 195,000 seeds per kg seed treatments sown at 40 plants per m2 at the normal depth of 10-20mm across all the environments.
Furthermore, there was also no significant difference in plant establishment between the large and mid-size seed sown deeper 30-40 mm at 40 plants per m2 target, compared to the smaller seed sown at normal depth at 40 plants per m2 target.
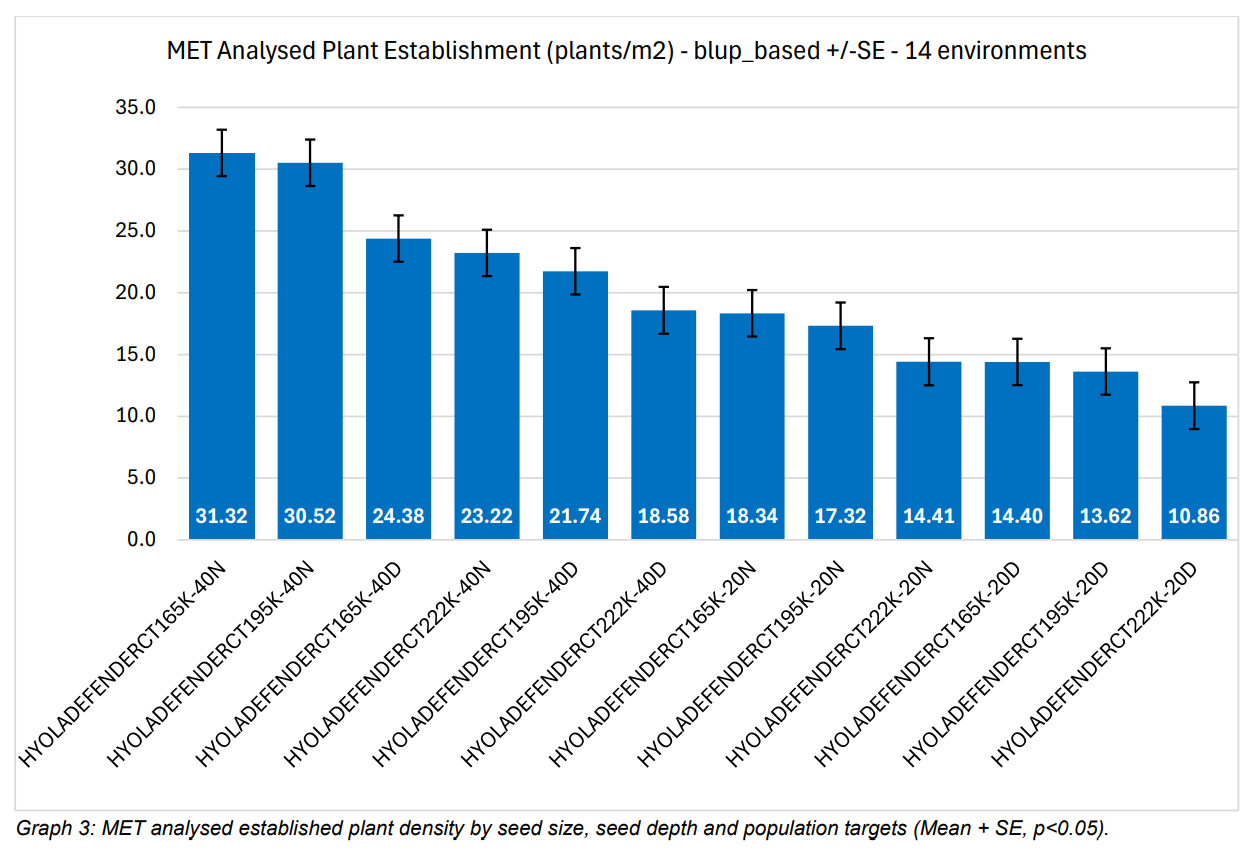
Graph 3 shows the decline in effective plant establishment with greater sowing depth and smaller seed size, which implies that a higher seeding rate would be required when sowing smaller seed especially at depth to establish the equivalent plant density as that of the larger seed.
This leads to increasing costs associated with the smaller seed at greater sowing depth treatments to achieve the agronomic benefits of more plants being additional weed competition and associated harvest management.
The lower established plant densities with some treatments achieved could be attributed to several factors combined such as seed size, population target and seeding depth. Some single sites exhibited better establishment from sowing deeper where subsoil moisture was better than on the surface, irrespective of seed size.
The different rainfall volumes that subsequently fell at individual sites after sowing, then had variable influences on continued germination and establishment of both normal and deep sown treatments.
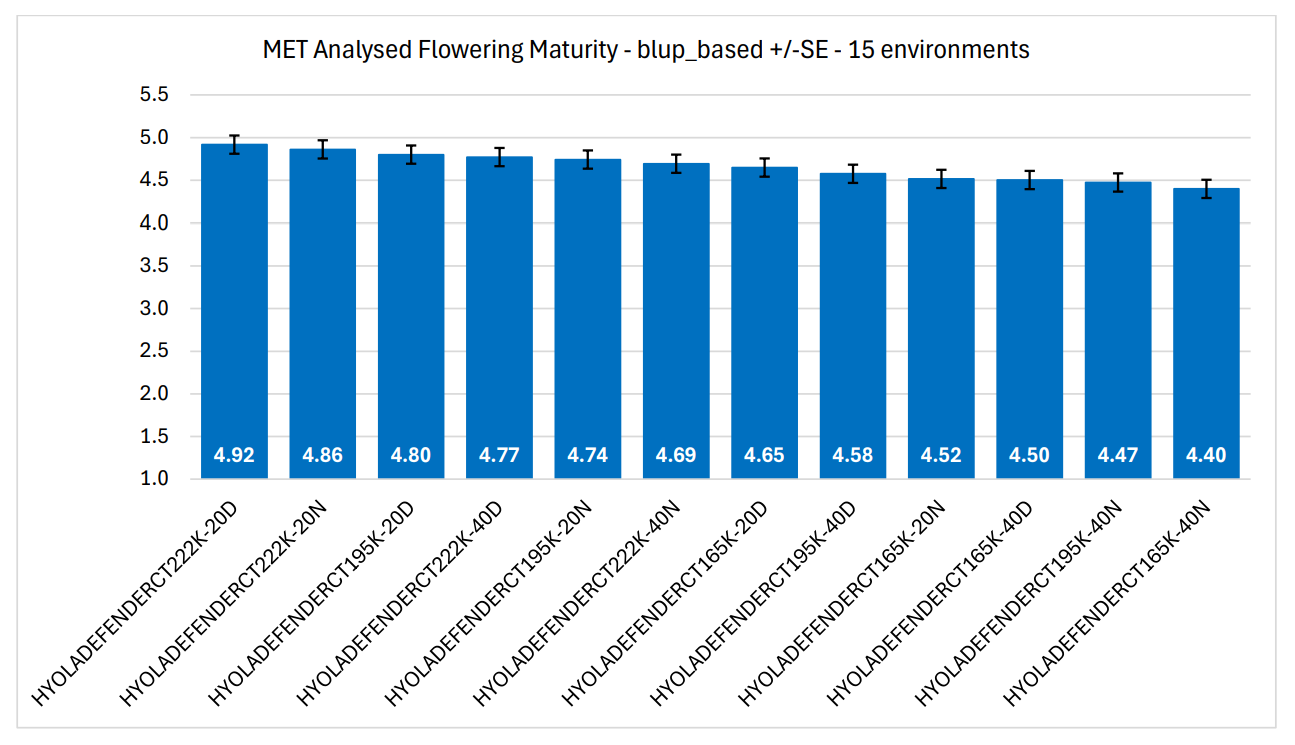
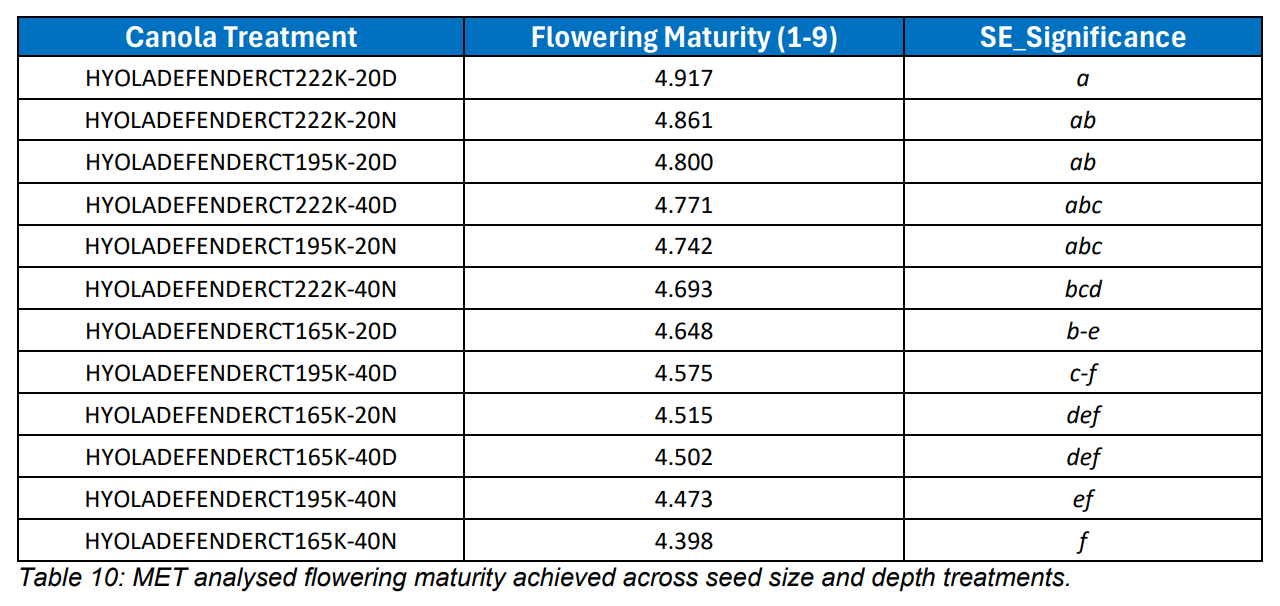
Graph 4: MET analysed flowering maturity by seed size, seed depth and population targets (Mean + SE, p<0.05).
The relative flowering maturity showed the trend of slowing down (later maturing) with the lower plant population target, especially for the smaller seed size at both normal and deep sowing levels.
The faster flowering growth habit was encouraged by larger and mid-size seed sown at the 40 plants per m2 targets, whether sown at normal or deeper depths.
There was no significant difference between 165,000 seeds per kg and 195,000 seeds per kg seed treatments sown at the normal depth of 10-20mm across all the environments.
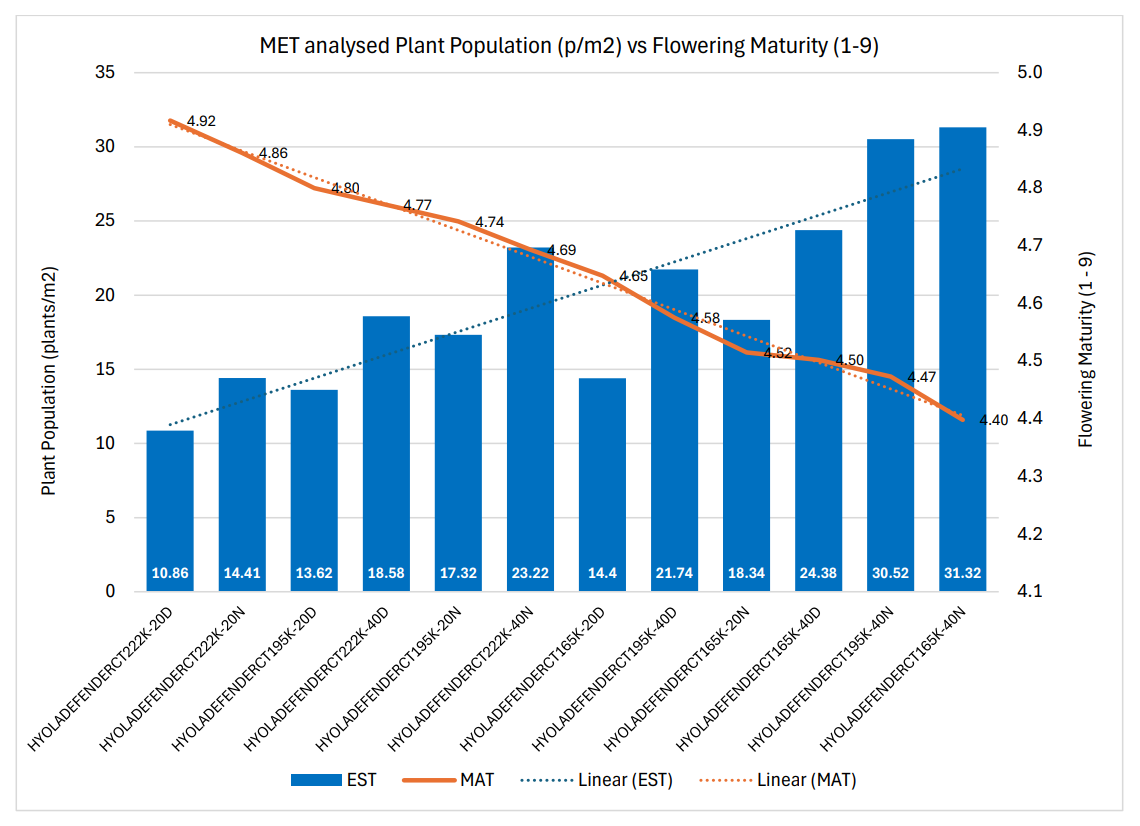
Graph 5: MET analysed established plants per m2 vs flowering maturity by seed size, seed depth and population targets.
The relationship between flowering maturity to plants established showed a general trend of maturity decreasing as plant population targets increased, however the 165,000 seeds per kg larger seed at 20 plants per m2 target also quickened up in maturity across all the environments.
This may be contributed to the larger seeds ability to germinate and sustain higher growth levels when compared to slower plant growth from the smaller seed treatments.
The 165,000 seeds per kg larger seed treatment also had similar flowering maturity with less established plants per m2 compared to the treatments 195,000 seeds per kg mid-size seed sown at 40 plants per m2 deep and the 222,000 seeds per kg smaller size seed sown at normal depth.
Grain yield
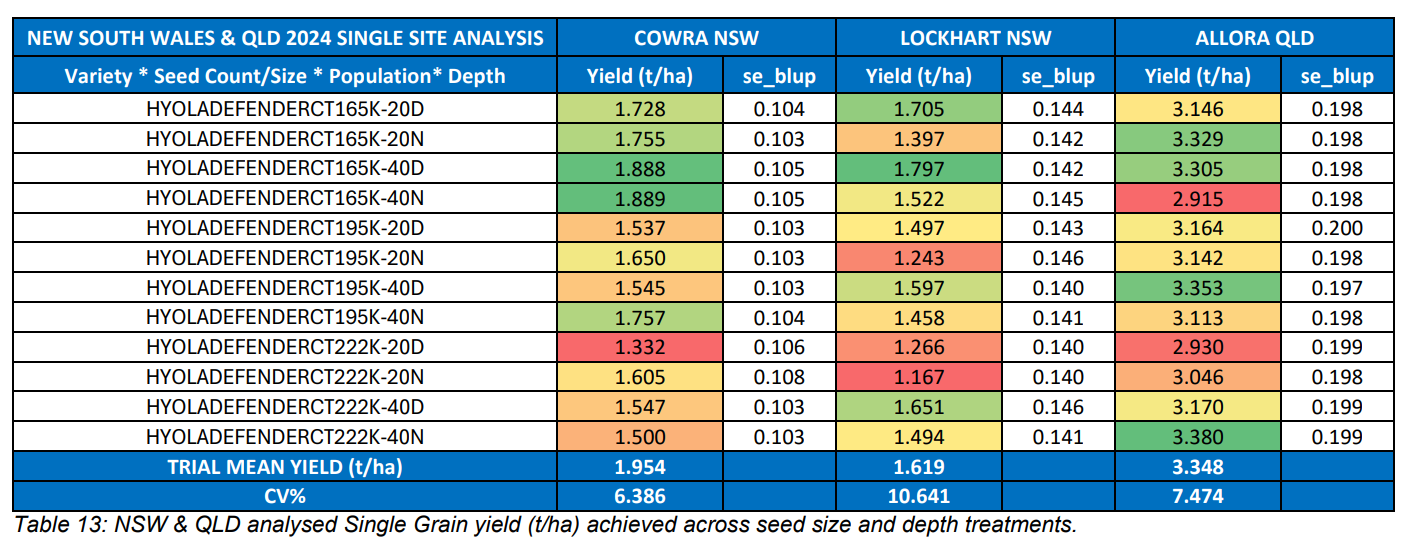
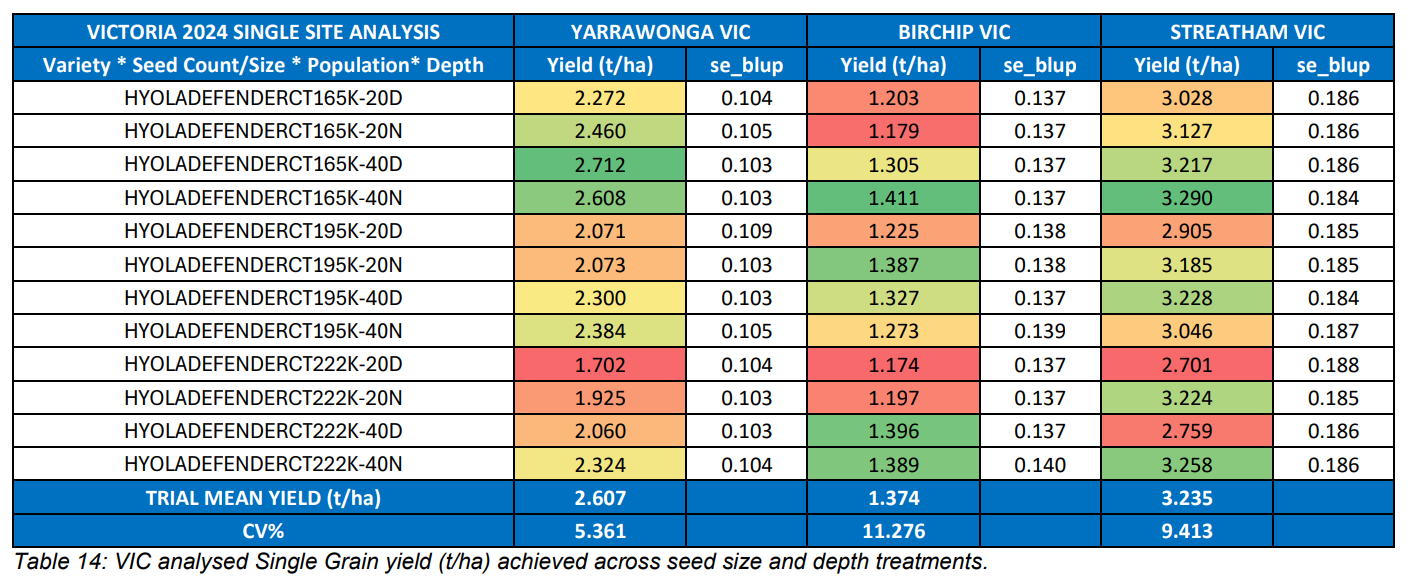
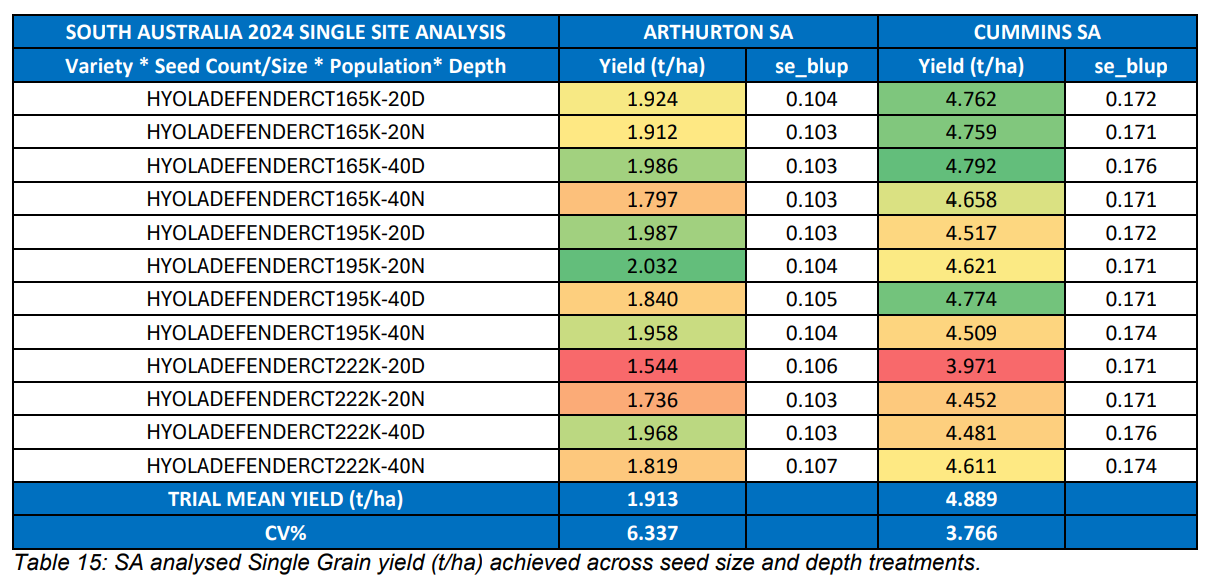
Some single site environments exhibited better establishment and yields from sowing deeper where subsoil moisture was better than on the surface, irrespective of seed size.
Establishment patterns and final yields were similar to what growers can experience with commercial canola crops. The different starting soil moisture profiles and variable rainfall events that subsequently fell at individual trial sites after sowing, had variable influences on continued germination, establishment and growth of both normal and deep sown treatments ultimately may have also affected final yields across some of the environments.
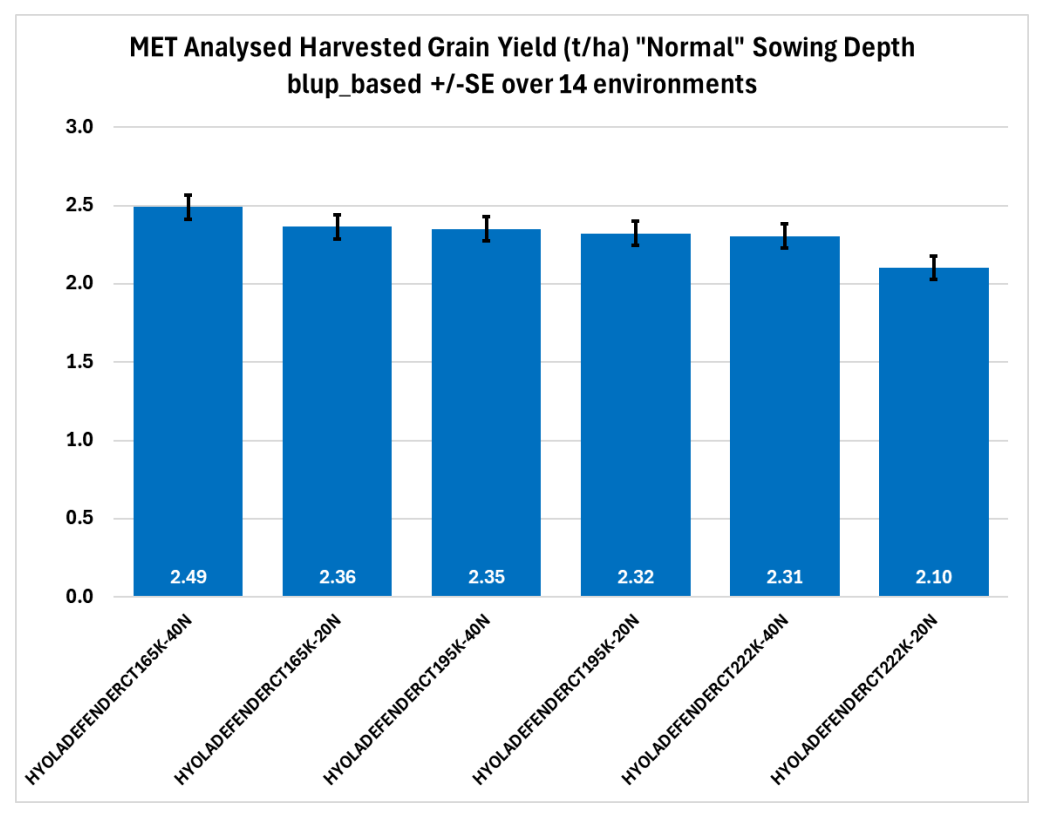
Graph 6: MET analysed harvested grain yield by seed size, normal sowing depth and population targets (Mean + SE, p<0.05).
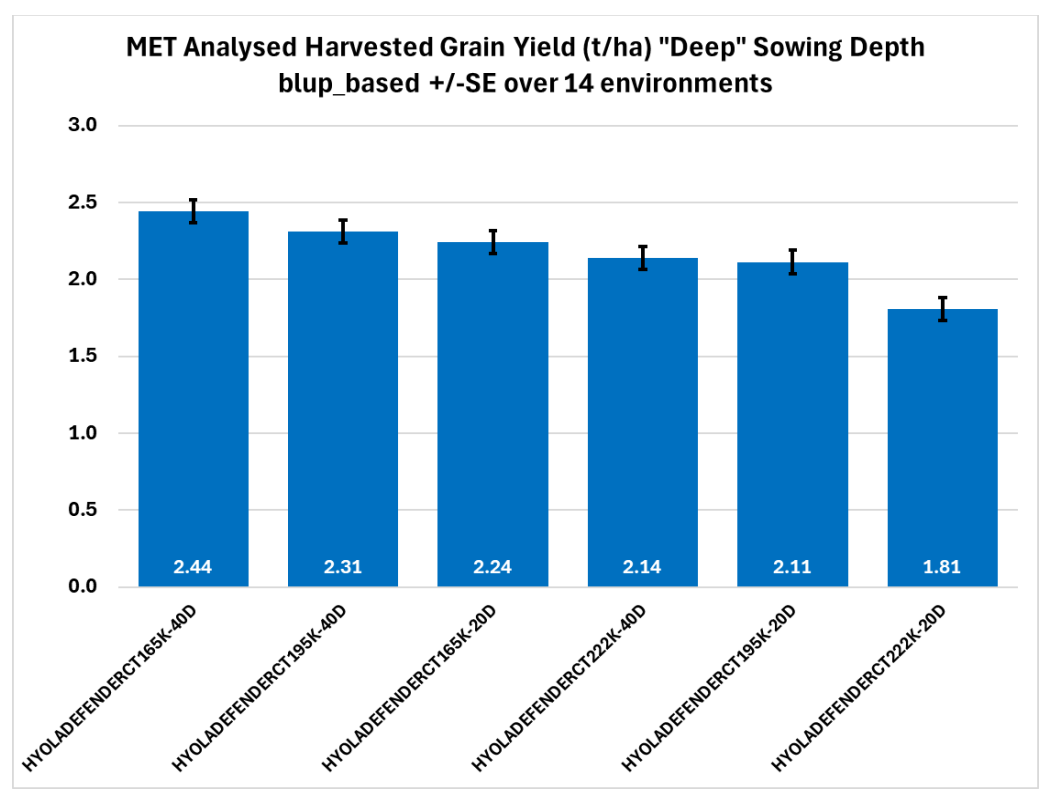
Graph 7: MET analysed harvested grain yield by seed size, Deep sowing depth and population targets (Mean + SE, p<0.05).
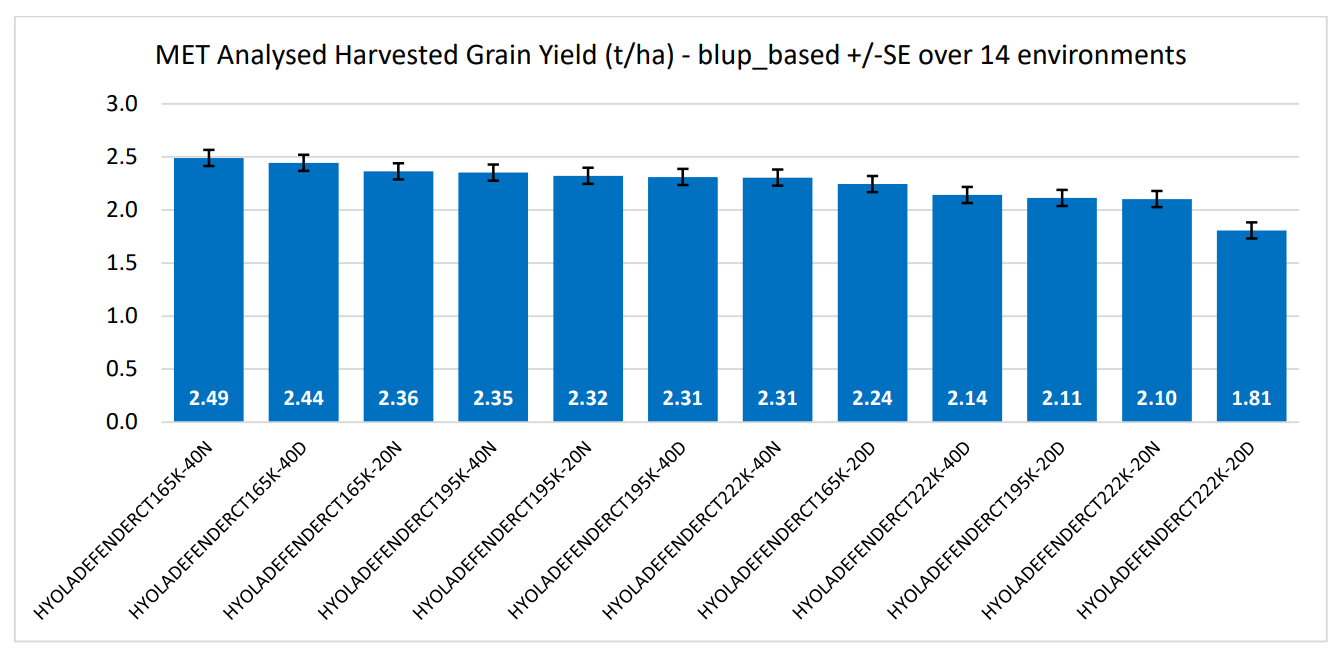
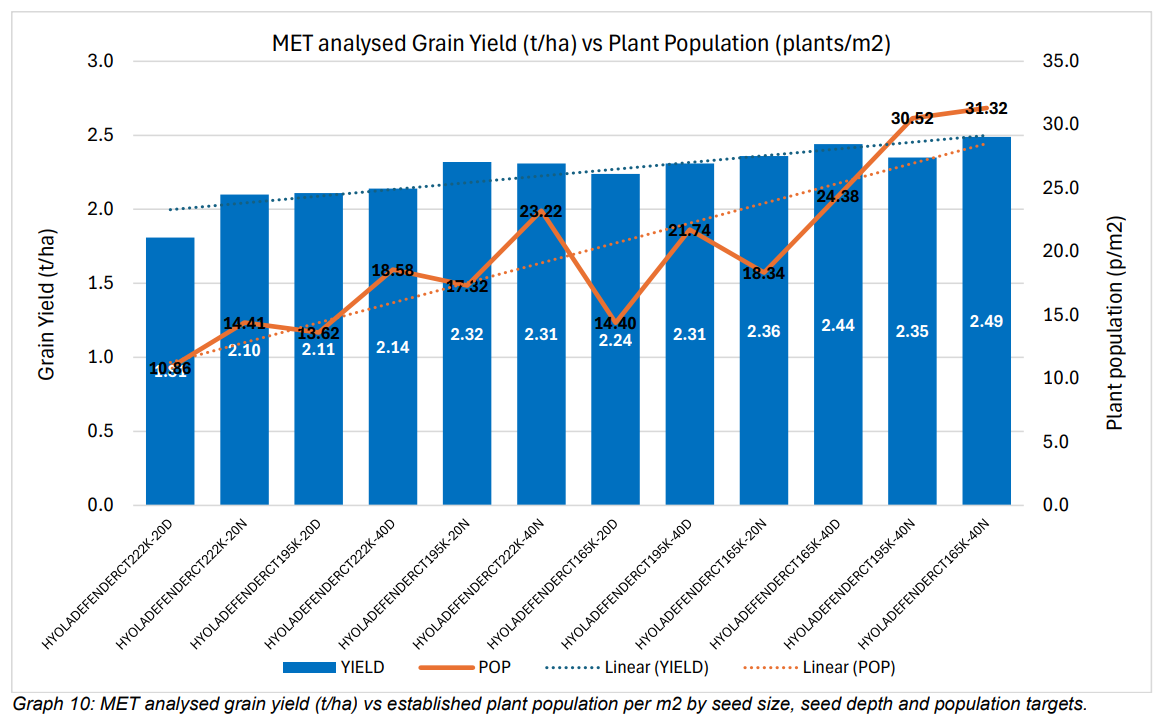
Graph 8: MET analysed harvested grain yield by seed size, seed depth and population targets (Mean + SE, p<0.05).
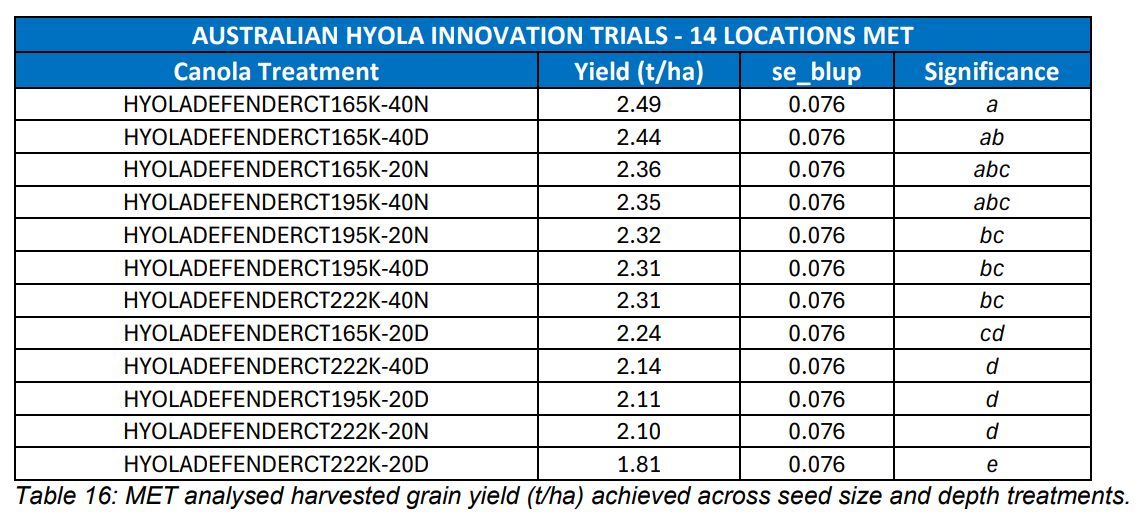
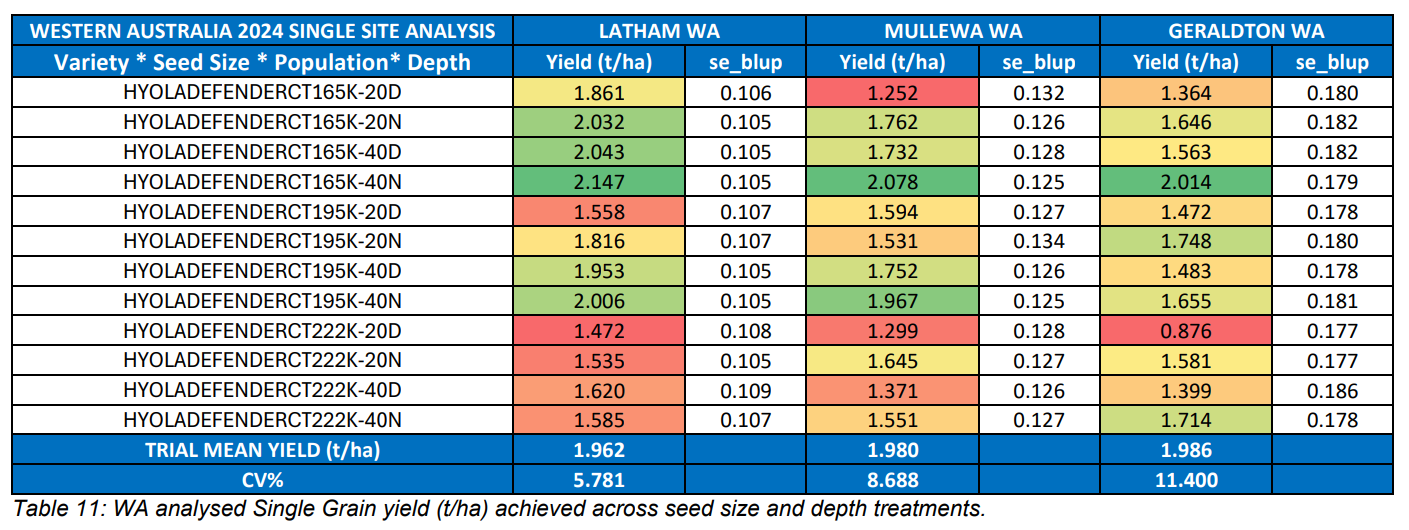
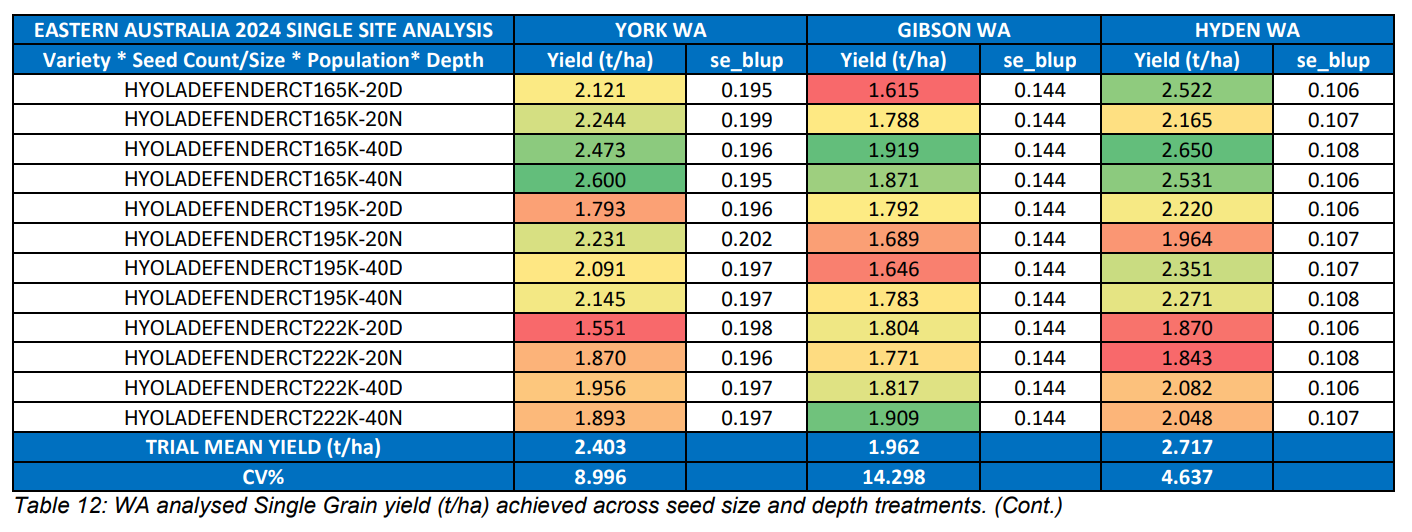
The larger seed size of 165,000 seeds per kg (>2mm) sown at normal depth for 20 or 40 plants per m2 targets showed some significantly greater (p<0.05) yield responses, compared to mid-size 195,000 seeds per kg (=2mm) sown at depth for 20 plants per m2 target and the small size 222,000 seeds per kg (<2mm) sown either normal or at depth whether 20 or 40 plants per m2 targets.
The 165,000 seeds per kg larger seed with a population target of 20 plants per m2 sown at normal depth treatment showed grain yields not significantly different to 222,000 seeds per kg smaller seed sown at 40 plants per m2 at normal depth. This result demonstrates the additional hybrid vigour associated with larger seed vs smaller seed and the ability of stronger growing plants to compensate for yield across many environments.
There was no significant difference between 165,000 seeds per kg sown at 20 or 40 plants per m2 in normal depth and the 195,000 seeds per kg treatment sown at 40 plants per m2 in the normal depth of 10-20mm across all the environments. The smaller 222,000 seeds per kg treatments sown at 20 or 40 plants per m2 in deep levels or 20 plants per m2 at normal depth showed significantly lower yields than smaller 222,000 seeds per kg at 40 plants per m2 in normal depth.
Graph 4 shows the decline in grain yield with greater depth and smaller seed size, which implies that a higher seeding rate would be required when sowing smaller seeds, especially at depth, to establish the equivalent plant density and potential yield as that of the larger seed treatments. Refer below to graphs 5 and 6 which show the complex relationships between MET analysed Grain yield to flowering maturity and comparing Grain yield to plants established.
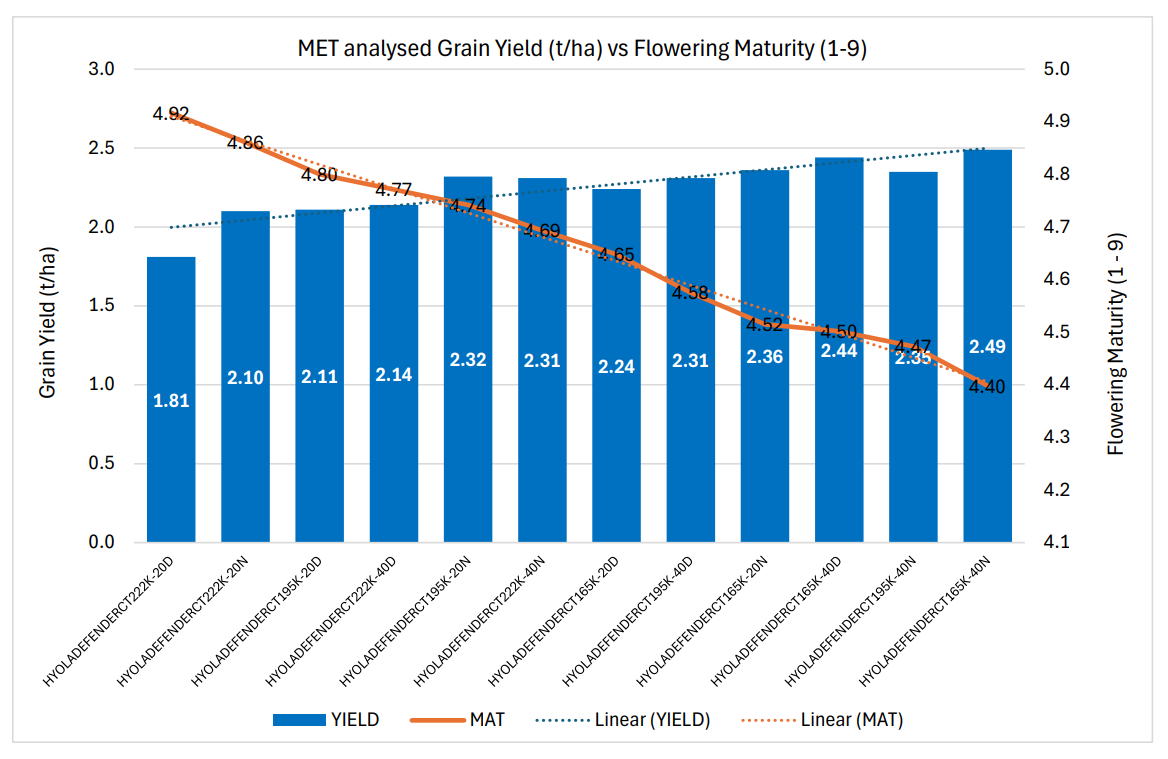
Graph 9: MET analysed grain yield (t/ha) vs flowering maturity by seed size, seed depth and population targets.
Grain Oil percentage
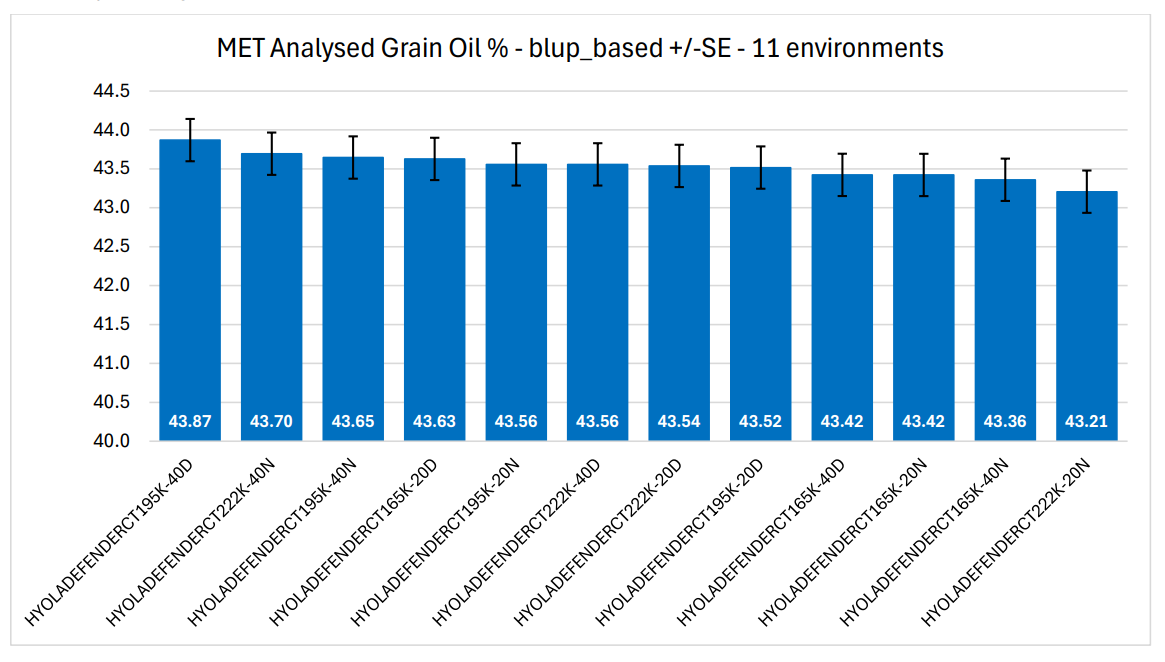
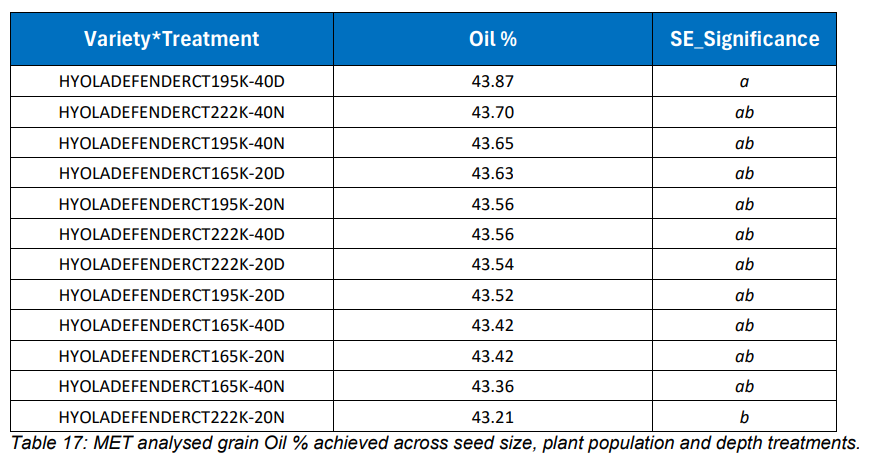
The different seed size, plant population target and sowing depth treatments showed very few significant differences for final grain oil %, which suggests that oil content is driven by a range of interacting factors not limited to genetics, soil water holding capacity, seasonal rainfall, temperature, soil structural impediments, soil nutrition, relative humidities and timing of desiccation or windrowing.
These results show that throughout many environments, there was only a 0.66% difference in oil % values across all treatments.
Simplified gross margins
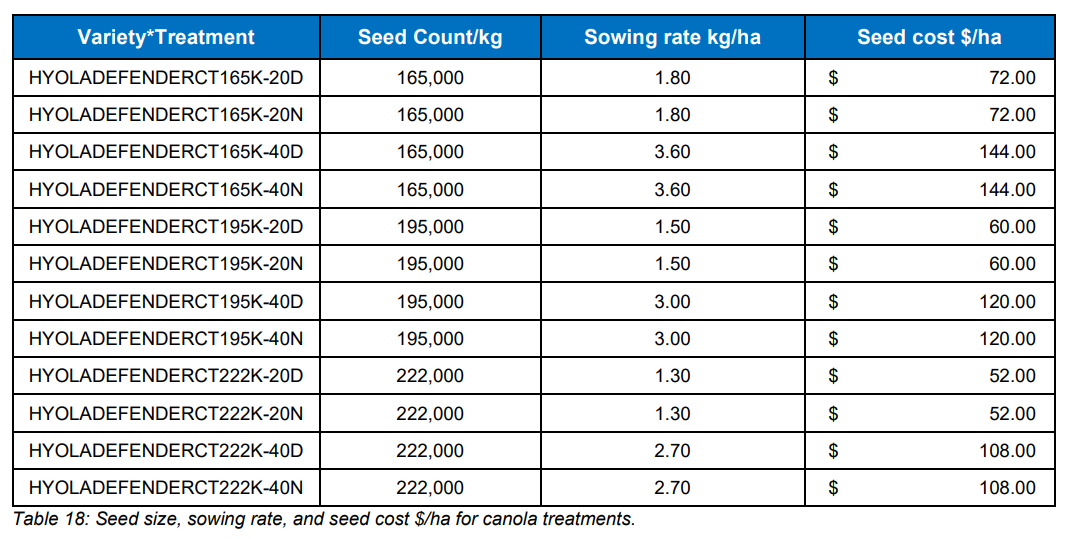
Table 18 shows the distribution of seed cost per hectare based on seed count, sowing rate required to achieve the calculated target plant density of either 20 or 40 plants/m2 and the value of seed. These values were determined from Tables 2 a-b.
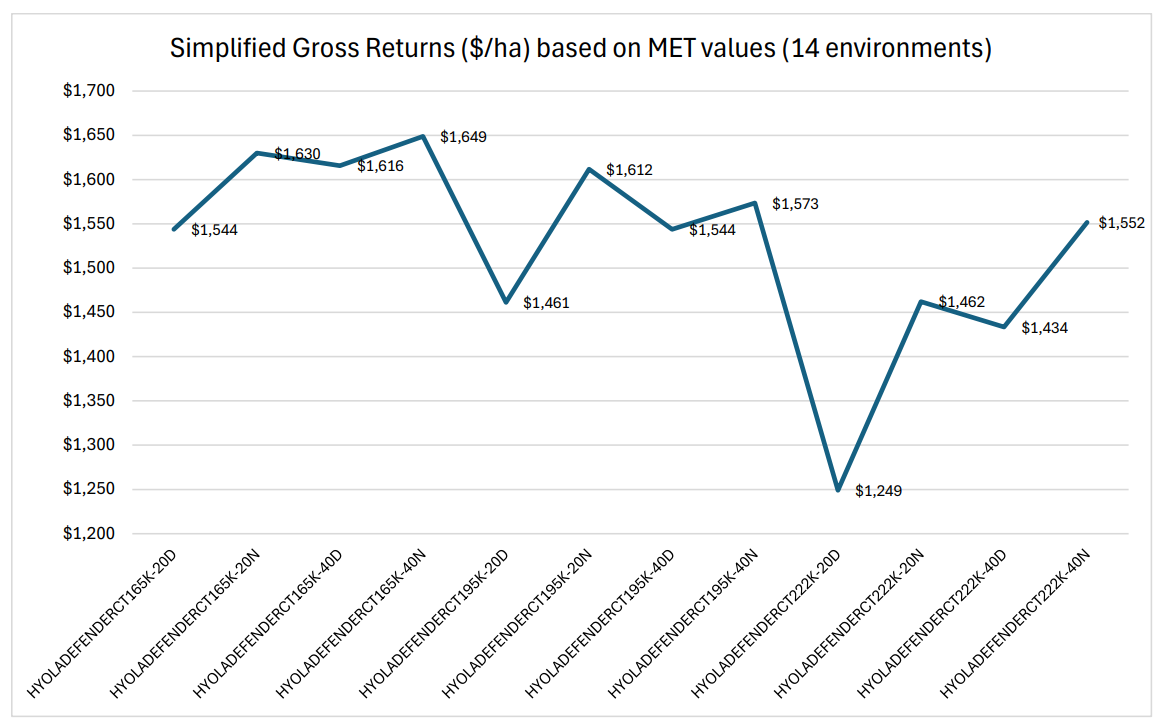
Graph 12: Simplified Gross Returns based on MET analysed yield values for all treatments over 14 environments.
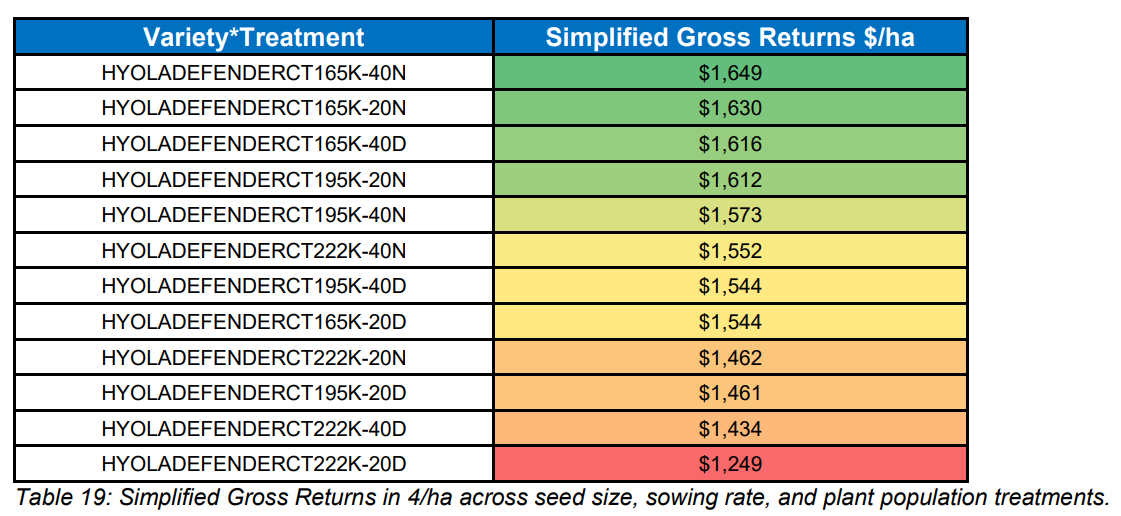
Table 19 highlights the gross return differences across 14 environments for the different treatments. The larger seed size of 165,000 seeds per kg (>2mm) sown at normal depth, for 20 or 40 plants per m2 targets and the 165,000 seeds per kg (>2mm) sown at greater depth, for 40 plants per m2 targets, showed the highest SGM values and best value equations.
The mid-size 195,000 (=2mm) sown at normal depth for 20 or 40 plants per m2 targets and the smaller 222,000 seeds per kg (<2mm) sown at normal depth for 40 plants per m2 target, then showed the next best SGM values. The 222,000 smaller seed along with the 195,000 mid-size seed sown at 20 plants per m2 deep showed the lowest SGM values and least value for money.
Graph 12 shows the declining trend in simplified gross returns with more depth and smaller seed size, which implies that a higher seeding rate would be required when sowing smaller seed especially at depth to establish the competitive plant densities and potential gross returns as that of the larger seed treatments.
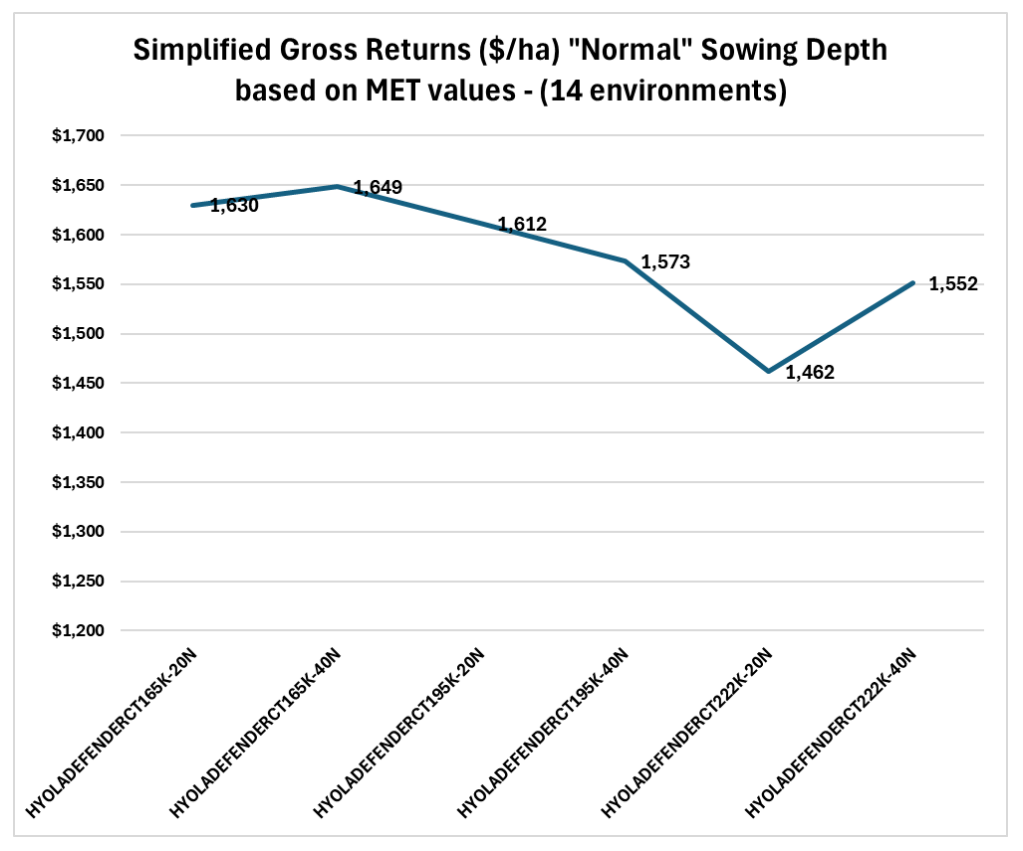
Graph 13: Simplified Gross Returns based on MET analysed yield values for all normal sowing depth treatments over 14 environments.
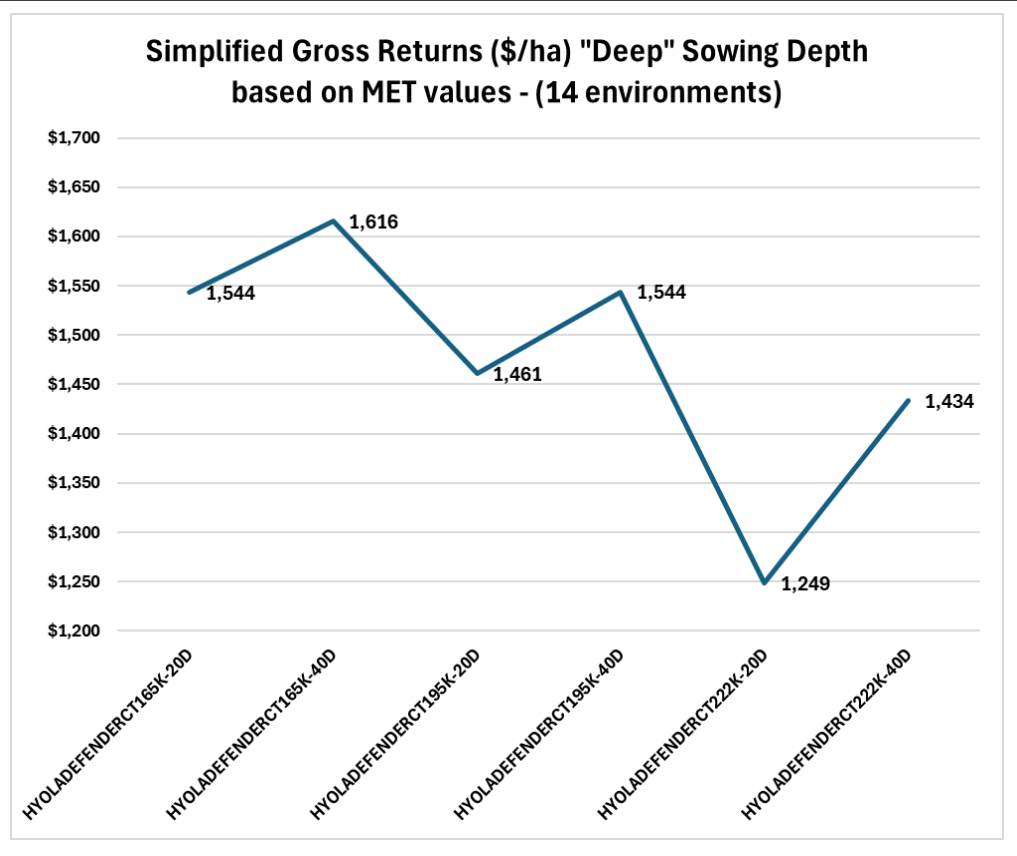
Graph 14: Simplified Gross Returns based on MET analysed yield values for all deeper sowing depth treatments over 14 environments.
Refer below to graphs 15, 16, 17, 18 and 19 which show the specific relationships between Simplified gross returns across single sites and different types of treatments.
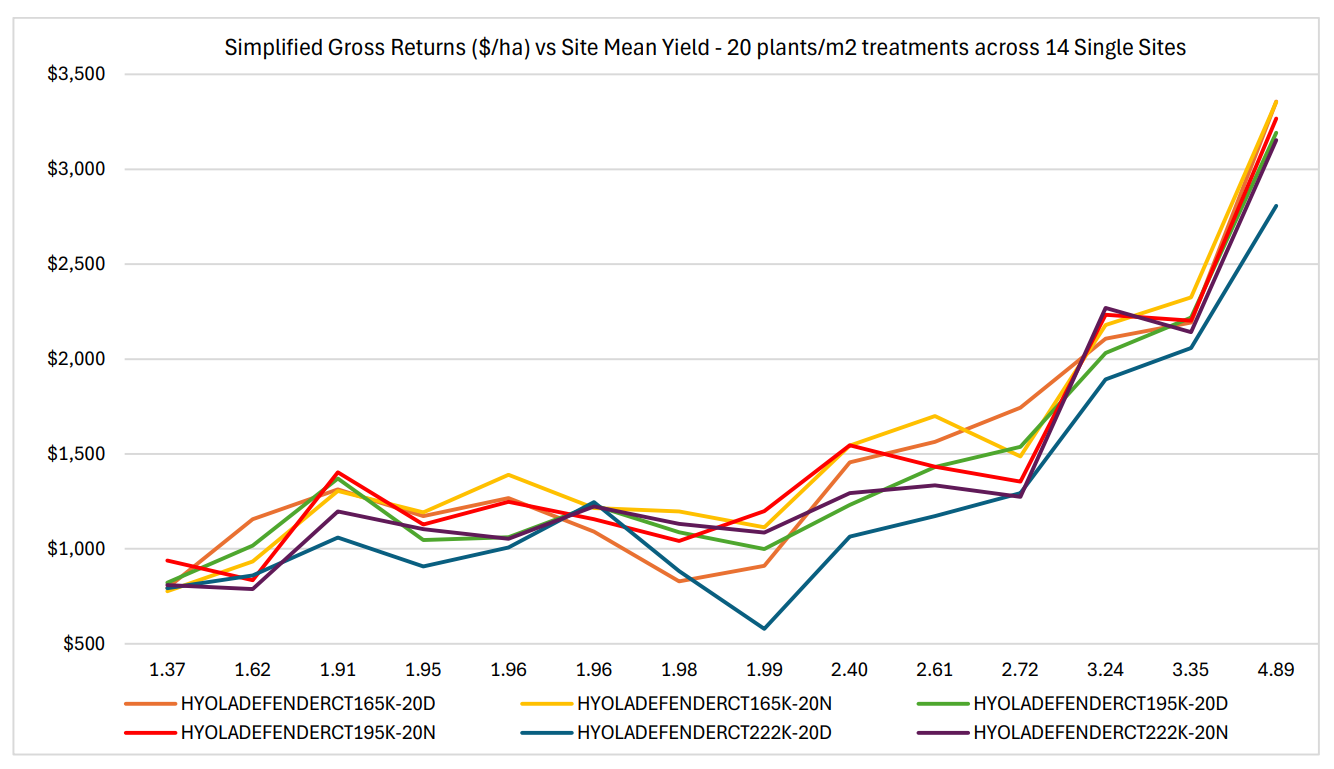
Graph 15: Simplified Gross Returns based on MET analysed yield values for all 20 plants per m2 treatments over 14 trials
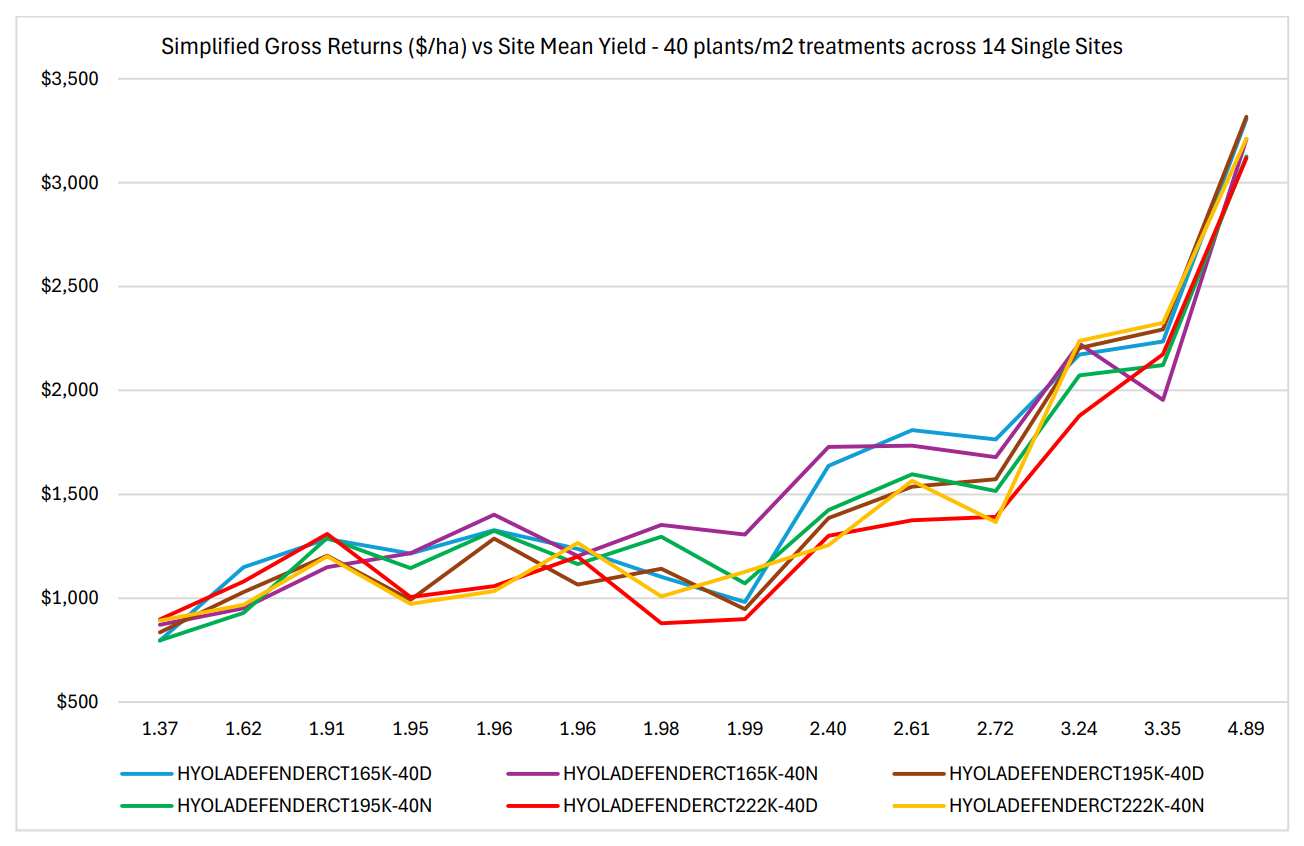
Graph 16: Simplified Gross Returns based on MET analysed yield values for all 40 plants per m2 treatments over 14 trials.
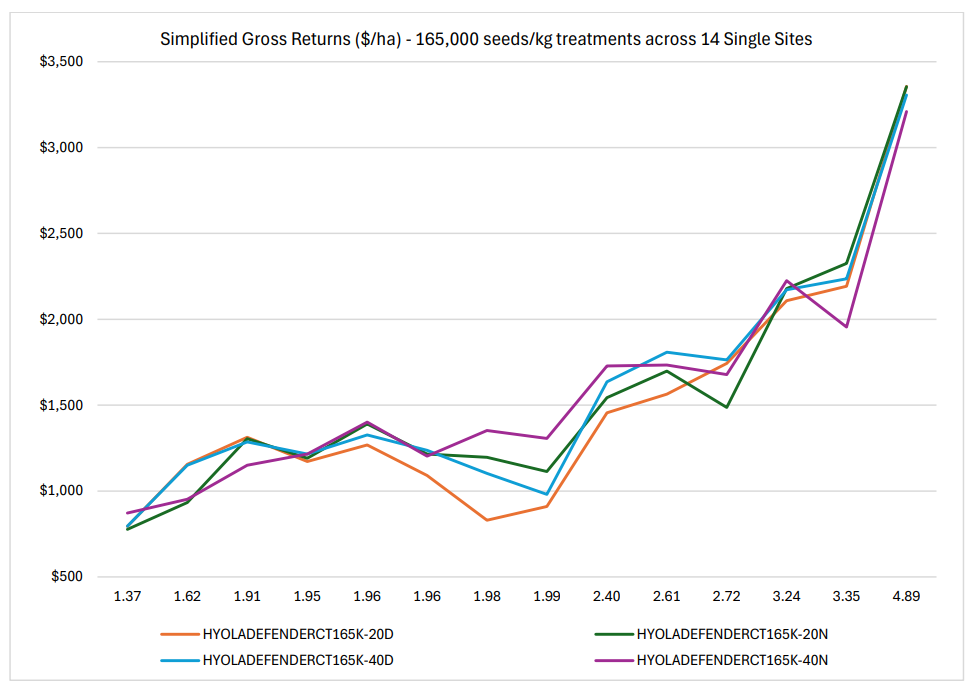
Graph 17: Simplified Gross Returns based on MET analysed yield values for all 165,000 seeds/kg treatments over 14 trials.
Graph 18: Simplified Gross Returns based on MET analysed yield values for all 195,000 seeds/kg treatments over 14 trials.
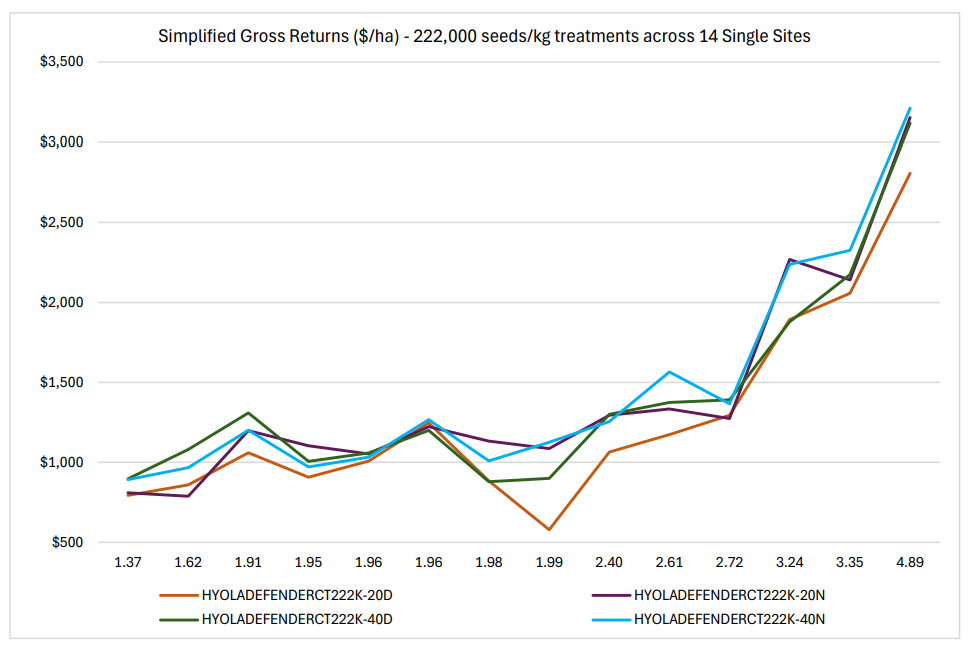
Graph 19: Simplified Gross Returns based on MET analysed yield values for all 222,000 seeds/kg treatments over 14 trials.
Conclusion:
Sowing smaller sized canola seed, especially at depth, can lead to lower plant establishment, later flowering, decreased yields and gross returns to growers and their associated profitability.
Even though soil temperatures and daily maximum soil temperatures (Tmax) were not measured at these sites, previous research has shown that diurnal variation increased at shallower sowing depths. Tmax varies between sites according to differences in weather, soil colour and texture.
Fletcher et al. (2024) showed results that demonstrate the impact of sowing depth on conditions experienced by emerging canola seedlings but indicate the soil environment is more favourable at depth. Research to explore genetic and management strategies to capitalise on deeper sowing will improve the reliability of canola establishment.
The value equation associated with upfront seed cost per ha drives the notion of growers wanting to reduce the sowing rate to reduce the upfront costs and potentially optimise $/ha returns. This research found that deeper sowing from 10-20mm down to 30-40mm across the different seed size treatments decreased plant establishment by 30% on average.
Established plant density for the larger seed size of 165,000 seeds per kg (>2mm) sown at normal depth showed some significantly greater (p<0.05) responses compared to mid-size 195,000 seeds per kg (=2mm) and the small size 222,000 seeds per kg (<2mm) treatments.
The relationship between flowering maturity to plants established showed a general trend of maturity decreasing as plant population targets increased, however the 165,000 larger seed at 20 plants per m2 target also quickened up in maturity across all the environments.
The larger seed size of 165,000 seeds per kg (>2mm) sown at normal depth for 20 or 40 plants per m2 targets showed some significantly greater (p<0.05) yield responses, compared to mid-size 195,000 seeds per kg (=2mm) sown at depth for 20 plants per m2 target and the small size 222,000 seeds per kg (<2mm) sown either normal or at depth whether 20 or 40 plants per m2 targets.
Across all the treatments, there was only a 0.66% difference in oil % values with very few significant differences. The highest SGM values and best value equations for growers were identified from the larger seed size of 165,000 seeds per kg (>2mm) sown at normal depth 10-20mm, for 20 or 40 plants per m2 targets and the 165,000 seeds per kg (>2mm) sown at more depth 30-40mm, for 40 plants per m2 targets.
The 195,000 seeds per kg (=2mm) mid-sized seed sown at normal depth 10-20mm, for 40 plants per m2 targets also provided competitive establishment, grain yields and gross returns for canola growers. These findings align well with previous research showing 150-200k seeds per kg is an optimal range for canola sowing seed and best value equations.
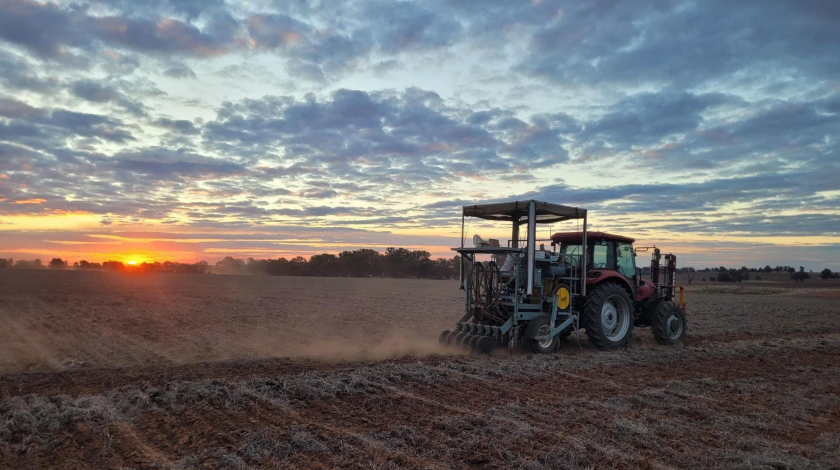
Image 2: Lockhart NSW 10-15mm sowing depth treatments being sown.
References
Rohan Brill1, Leigh Jenkins2 and Matthew Gardner³ (2014) GRDC Canola establishment; does size matter?
Rohan Brill¹, Matthew Gardner², Leigh Jenkins³ and Tim McNee4 (2013) GRDC Canola establishment: effect of variety choice seeding depth and phosphorus rate
Butler DG, Cullis BR, Gilmour AR, Gogel BJ, Thompson R (2023) ASReml-R Reference Manual Version 4.2 VSN International Ltd, Hemel Hempstead, HP1 1ES, UK
Andrew Fletcher1, Kenton Porker2, Jackie Bucat3, Matthew Nelson1, Colin McMaster4, Andrew Ware5, Brett Masters5, Chloe Rout6, Thomas Jones7, Rohan Brill8, Rachael Whitworth9, Maurie Street10, Danielle Lannin-England11, John Kirkegaard6 (2024) Sowing Depth and Seed Bed Conditions for Canola Establishment
French RJ, Seymour M, Malik RS (2016) Plant density response and optimum crop densities for canola (Brassica napus L.) in Western Australia. Crop & Pasture Science 67, 397–408.
Heinrich AJ, Liddle WA, (2023) Pacific Seeds, Agronomic and financial outcomes associated with various plant population targets across different Spring canola hybrids. Pacific Seeds website, accessed 31 December 2024, https://www.pacificseeds.com.au/wp-content/uploads/2024/06/2024- pacific-seeds-canola-population-research-paper-final.pdf
Kudnig RJ, (2021) Pacific Seeds, Optimising the gross return value proposition of farmer-retained OP TT vs Hybrid CT® and TT canola with varying seed size and plant population targets, GRDC website, accessed 21 January 2024, https://grdc.com.au/resources-and-publications/grdc-update-papers/tabcontent/grdc-update-papers/2021/02/optimising-the-gross-return-value-proposition-of-farmer-retainedop-tt-vs-hybrid-ct-and-tt-canola-with-varying-seed-size-and-plant-population-targets
Lemerle D, Luckett DJ, Hanwen Wu, Widderick MJ (2017) Agronomic Interventions for weed Management Crop Science 95, 69-73.
Acknowledgements
Paper peered by Justin Kudnig, National Technical Canola Manager, Pacific Seeds Australia.
Pacific Seeds Australia – a Subsidiary of Advanta Seeds.
Richard Devlin, Living Farms, York WA
Nic Amos, Kalyx Australia, Young NSW,
Grant Thompson, Crop Circle Consulting, Geraldton WA
Luke Marquis, Rob Hughes, SEAR, Esperance WA
Audrey Gripper, Southern Farming Systems, Inverleigh Vic
Andrew Heinrich, Technical Specialist Canola WA
Pacific Seeds Australia
1 Brookfield Terrace Jane Brook WA 6056
+61 (0)473 520 818
andrew.heinrich@advantaseeds.com
Willow Liddle, Canola Breeder.
Pacific Seeds Australia
268 Anzac Avenue
Toowoomba, Qld, 4350
+61 (0)455 746 186
willow.liddle@advantaseeds.com
Acknowledgements Paper peered by Justin Kudnig, National Technical Canola Manager, Pacific Seeds Australia. Pacific Seeds Australia – a Subsidiary of Advanta Seeds. Richard Devlin, Living Farms, York WA Nic Amos, Kalyx Australia, Young NSW, Grant Thompson, Crop Circle Consulting, Geraldton WA Luke Marquis, Rob Hughes, SEAR, Esperance WA Audrey Gripper, Southern Farming Systems, Inverleigh Vic Contact Details Andrew Heinrich, Technical Specialist Canola WA Pacific Seeds Australia 1 Brookfield Terrace Jane Brook WA 6056 +61 (0)473 520 818 andrew.heinrich@advantaseeds.com Willow Liddle, Canola Breeder. Pacific Seeds Australia 268 Anzac Avenue Toowoomba, Qld, 4350 +61 (0)455 746 186 willow.liddle@advantaseeds.com