Download The

Optimising the Gross Return value proposition when comparing Farmer Retained OP TT vs Hybrid CT® and TT canola with varying seed sizes and plant population targets
Justin Kudnig, Pacific Seeds
Key messages
• Grading OP TT canola seed to >2mm provides increased plant establishment, grain yield and gross returns
• Higher yielding CT® and TT hybrids provide consistent higher grain yields and gross returns than OP TT varieties
• CT® and TT hybrids with seed sizes of =2mm or >2mm established at lower plant populations can provide higher
grain yields and gross returns than OP TT varieties graded to >2mm at higher plant populations.
Aims
This research examines the differences in plant establishment (p/m2 ), harvested grain yield (t/ha) production for 5 different hybrids versus 3 open pollinated (OP) TT varieties (farmer retained source) with various seed sizes to determine the best gross return ($/ha) value propositions for growers.
Introduction
Australian canola growers and agricultural advisors have been seeking increased scientific information and recommendations around OP TT variety performance versus new CT® and TT hybrids, where growers perceive agronomic advantage by using OP TT seed graded to larger seed sizes and planted at higher plant populations.
This research was to further ascertain the effect of canola seed size and interactions with plant populations of various new CT® and TT hybrids vs OP TT varieties containing different genetic backgrounds and herbicide tolerant technologies on harvested grain yield and gross return value equations for growers.
Previous published literature has identified sometimes differing results in this field of research where in general terms, larger canola seed size, especially hybrids have provided higher % establishment, especially when planted deeper.
Brill et al. (2015) demonstrated that hybrid cultivars with larger seed sizes were able to maintain higher emergence rates and grain yield compared with open-pollinated cultivars from deep sowing, as well as showing that larger seed size of both hybrid and open-pollinated canola increased early biomass accumulation and final grain yield.
Harries and Seymour (2018) found that seed size effects on canola emergence, yield or seed quality were not significant. Increasing seed size had a positive linear association with early canola biomass and 1000-seed weights, whereas both days to flowering and days to the end of flowering had a negative linear association with seed size.
In 24 experiments conducted across a range of agricultural environments in Western Australia between 2010 and 2014, French et al. (2016) reported grain yield response to crop density was adequately described by an asymptotic model (where yield approaches but never quite reaches a ceiling at very high density).
Zhang et al. (2016) demonstrated that relative yield and profit of Australian hybrid compared with open-pollinated canola is largely determined by growing-season rainfall which forms a key component of environment (E).
Method
9 field research extension sites (RCB * 3 replicates) across Australia were sown at Geraldton WA, Morbinning WA, Katanning WA, Kojonup WA, Yarrawonga Vic, Lake Bolac Vic, Horsham Vic, Wallendbeen NSW and Lockhart NSW.
These 9 trial environments had a wide range of differences for seasonal rainfall, cropping histories, soil types and soil pH, whilst applying a combination of Best Management Practice (BMP) and District Standard Practice (DSP) treatments per each location, thus enabling a diverse set of data collection for accurate comparison.
9 canola varieties in total were compared, 3 open pollinated and 6 hybrids across 2 different herbicide technology groups with 3 different target populations. Herbicide tolerance technologies included, CT® - Clearfield® + Triazine Tolerant and TT - Triazine Tolerant.
Target Populations treatments included 15 plants per m2, 25 plants per m2 and 40 plants per m2 based on an estimated 75% establishment survival factorial by adjusting all seed packet weights.
Thousand-seed weight (TSW) values across varieties varied from 2.47 (405,000 seeds per kg) to 6.75 (148,000 seeds per kg) and effectively seed sizing ranged from <1.8mm to >2mm in diameter.
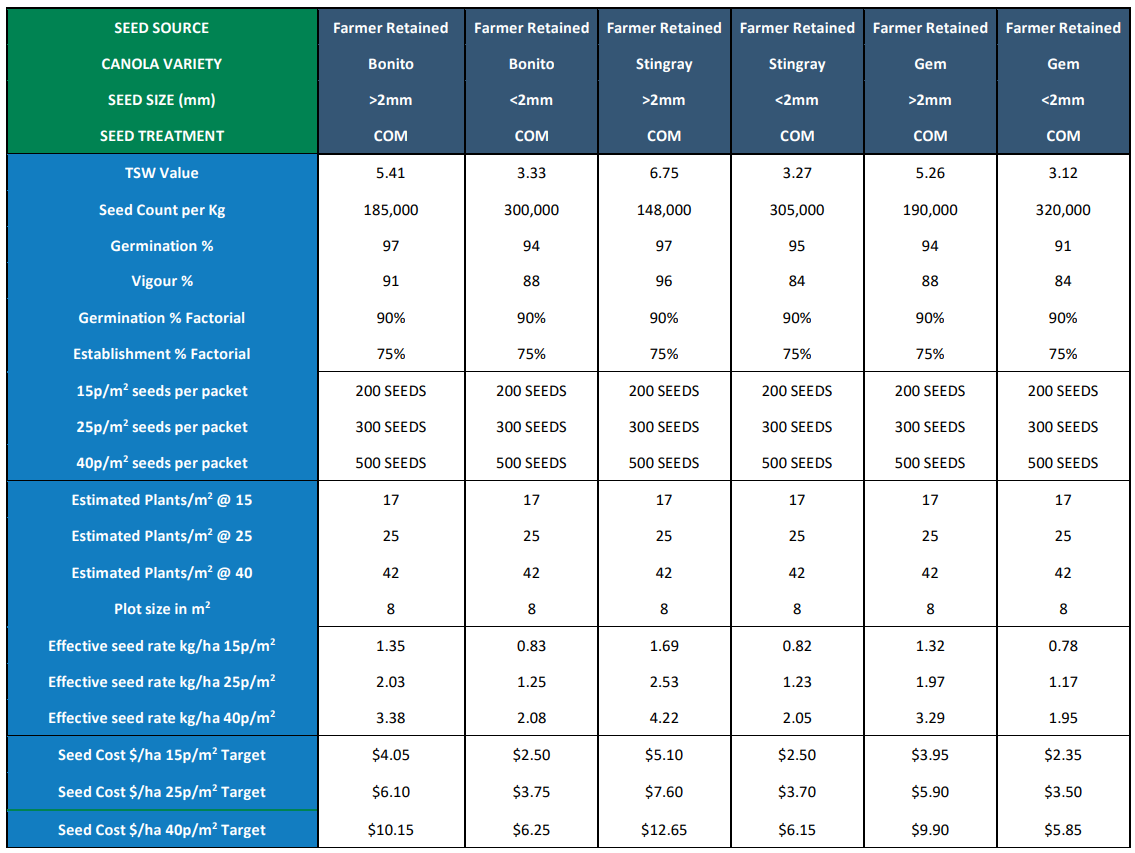
Table 1: Overall 2020 Seed quality and sowing rate details including seed cost $/ha assumptions for (OP) varieties
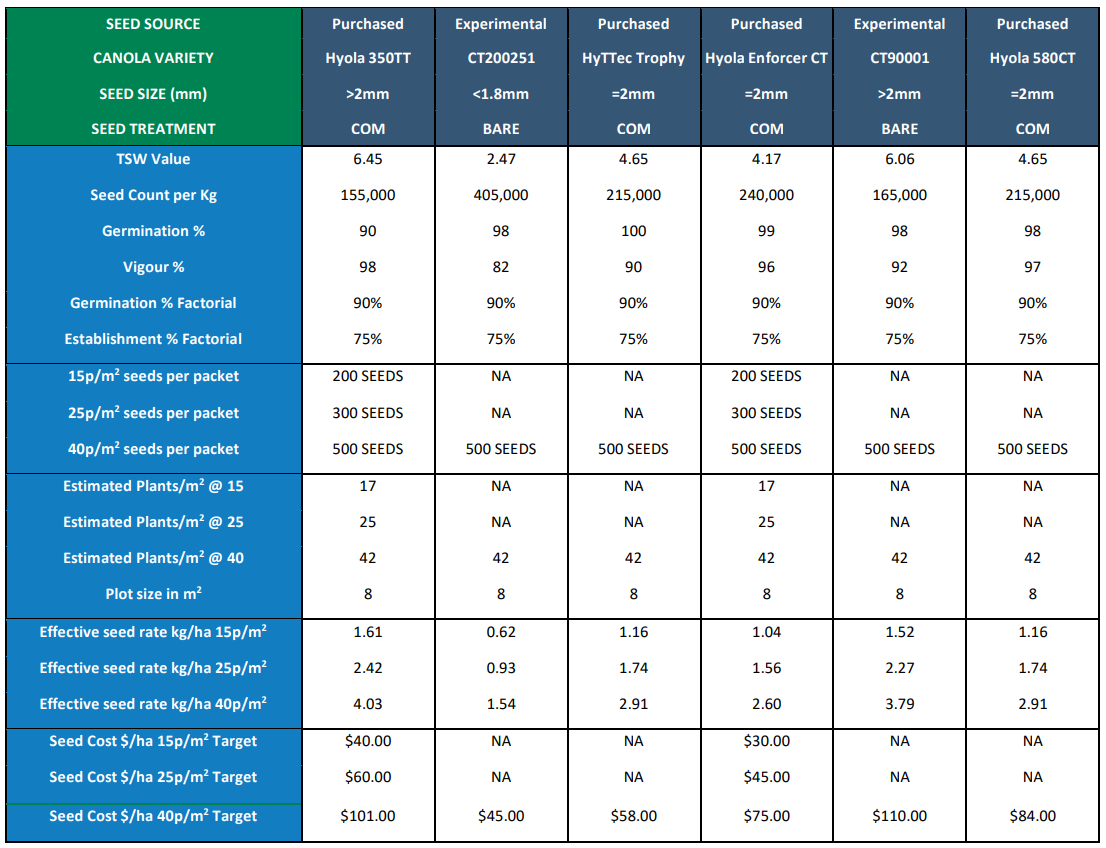
Table 2: Overall 2020 Seed quality and sowing rate details including seed cost $/ha assumptions for hybrid varieties
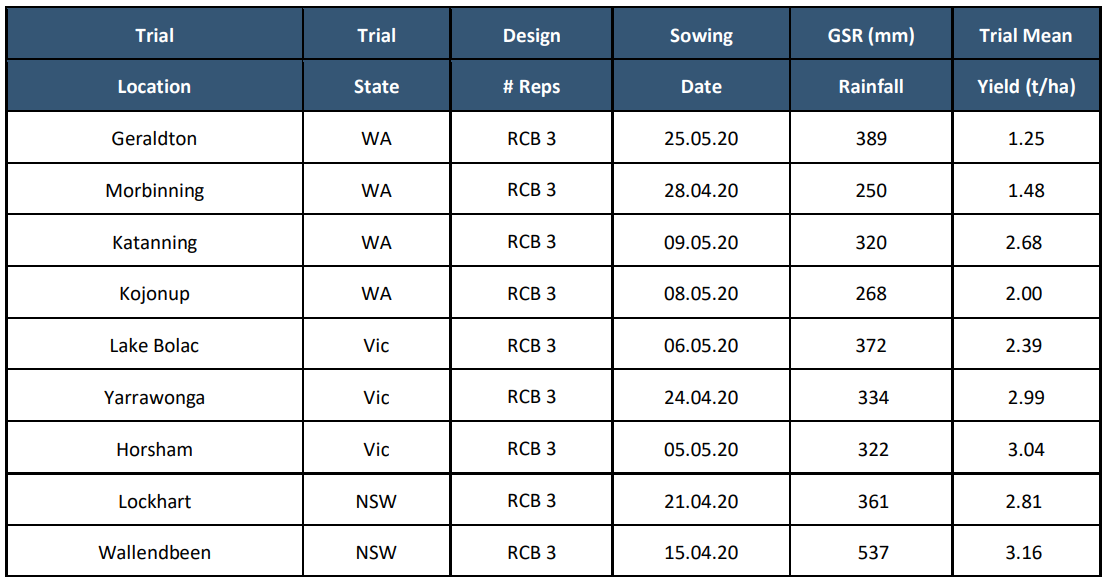
Table 3: 2020 Individual trial location sowing and seasonal details
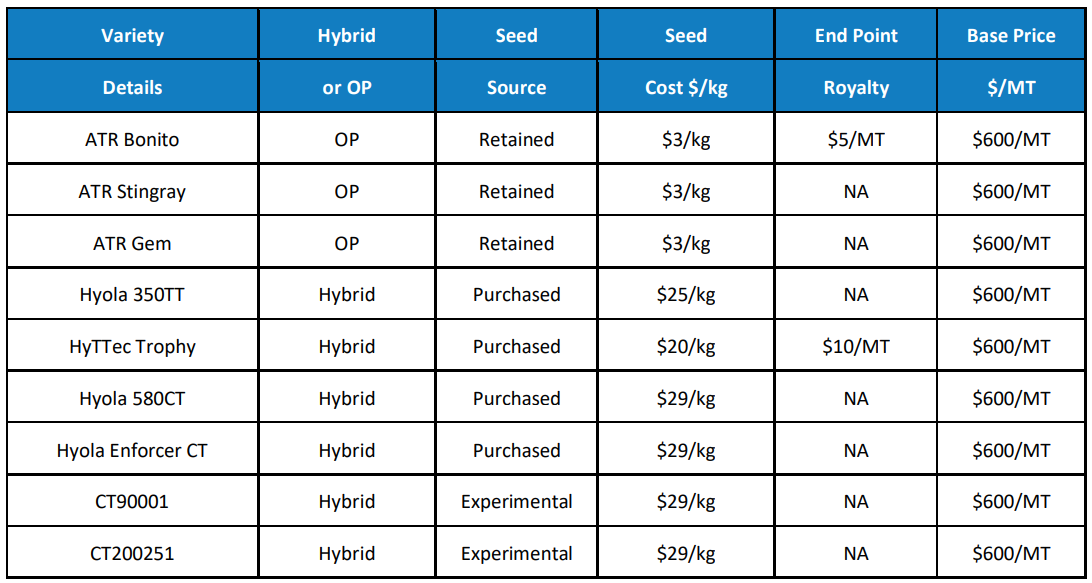
Table 4: 2020 Variety seed source details and Gross Return components assumptions
Measurements across all replicates and environments conducted were plants per m2 using 4*1m row counts per plot 14 DAS and 28DAS, visual subjective vigour ratings at 4-6 leaf stage, visual maturity ratings at flowering and maturity, , grain yield (t/ha) using plot harvesters and Gross return calculations using assumptions from Tables 1 and 4.
Population and Yield Analysis for Single Sites were performed fitting Entry, Popm2, TargetPop, TSW as fixed linear factors and spatial adjustments performed using the auto-regressive model hence giving a BLUE output for each site. Statistical Reference: Using ASReml (Gilmour et al., 2010).
In addition, Yield was further investigated using Single Step Factor Analytic MET (Multiple Environment Trial) analysis with ASReml in a model with Plants/m2 as a linear fixed factor with Composite Entry as a random factor hence giving a BLUP for each site. Spatial adjustments were determined using the auto-regressive model. Significant G*E*M effects were identified by the MET analysis. Statistical Reference: Using ASReml (Gilmour et al., 2010).
Results and discussion
With respect to plant establishment, French et al. (2016) showed that canola field establishment varied from 0.3 to 1 and was higher at low target densities with a median of 0.585 at a target density of 40 plants/m². This research showed in Graph 1, that across variety by seed size treatments mean field establishment varied from 0.51 to 0.87 for the 15 plants per m2 target, 0.43 to 0.79 for the 25 plants per m2 target, and 0.42 to 0.76 for the 40 plants per m2 target.
Graphs 2 and 3 illustrate the differences between a drier seasonal growing profile compared to a wetter rainfall zone. Geraldton represents an example of one of 3 trial environments that clustered for both establishment and yield results, showing lower overall percentage establishment for all variety treatments and differences between hybrid and OP varieties were exacerbated for plant establishment. Most of the hybrids showed excellent establishment under less optimal emergence conditions.
Kojonup which represents an example of one of the 6 remaining trial environments where overall rainfall and establishment conditions where more conducive to much higher levels of plant establishment across all treatments. The OP TT varieties regardless of seed size, showed increased levels of overall plant establishment compared to the Geraldton environment, however most of the hybrids again demonstrated the highest % levels of establishment.
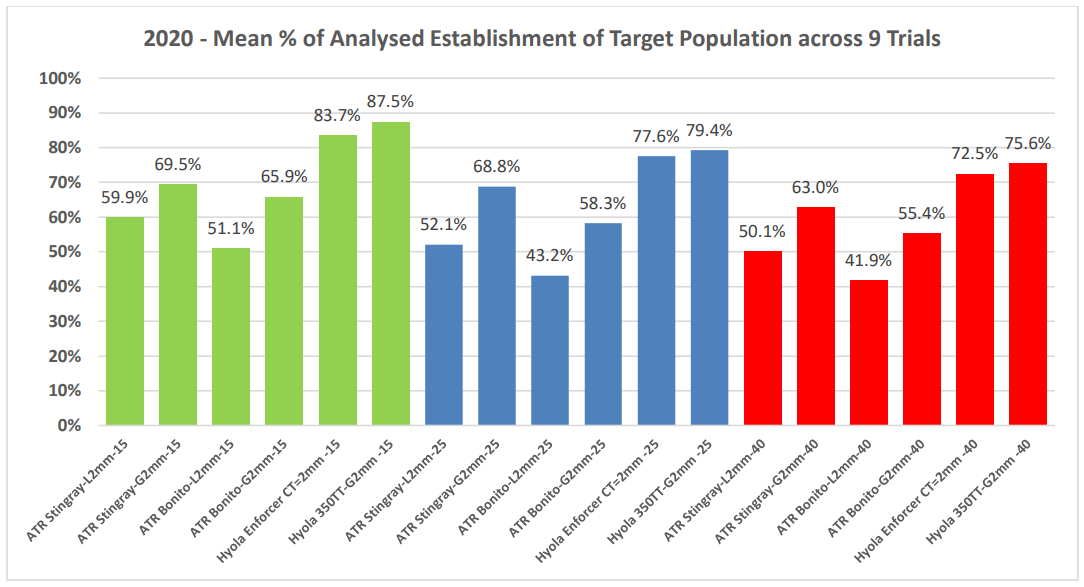
Graph 1: Mean % of Target population achieved by variety by seed size treatments across 9 environments.
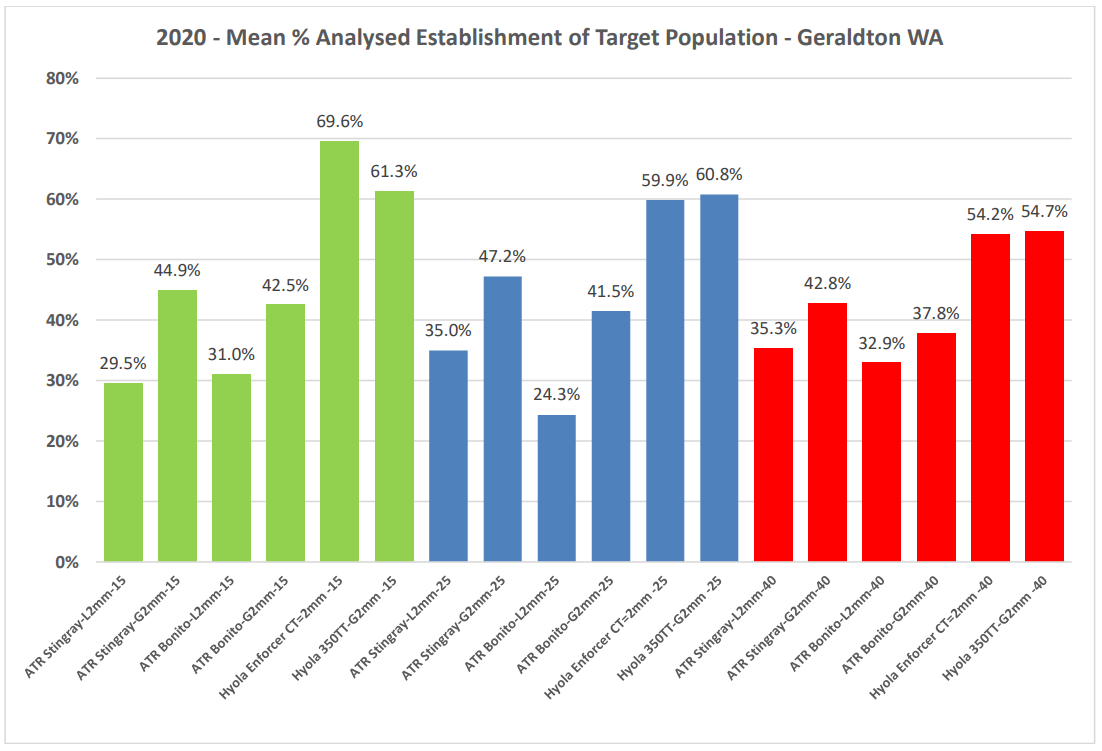
Graph 2: Mean % of Target population achieved by variety by seed size treatments for the Geraldton environment.
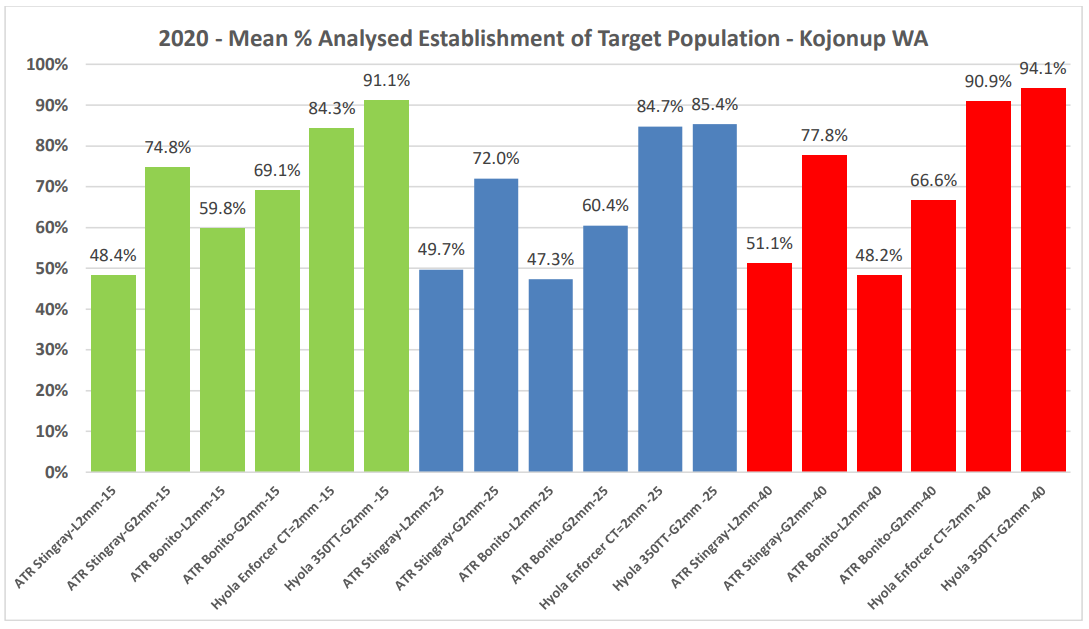
Graph 3: Mean % of Target population achieved by variety by seed size treatments for the Kojonup environment.
French et al. (2016) showed little difference between optimum densities for hybrid and open- pollinated cultivars, and optimal in the high rainfall zone were about 10 plants/m² higher than in low and medium rainfall zones.
This research demonstrates that site environmental conditions and variety genetics had the largest effects on final established % of plant numbers rather than (TSW) seed size and target plant populations.
Yield responses using the MET analysis showed that Environment is the key factor, followed by genetics. The 40 plants per m2 target treatment provided the highest yields across all trial locations. Refer to Table 5 for MET % variance factor comparisons.
If population establishment is known, adding seeding rate to the model does not contribute additional information to the model. However, in a real-life situation, seeding rate is the single biggest seed-related factor growers can control to target a specific establishment. If Pop/m2 is removed from the Analysis Model on Individual Trials, then TargetPop and TSW factors become more significant.
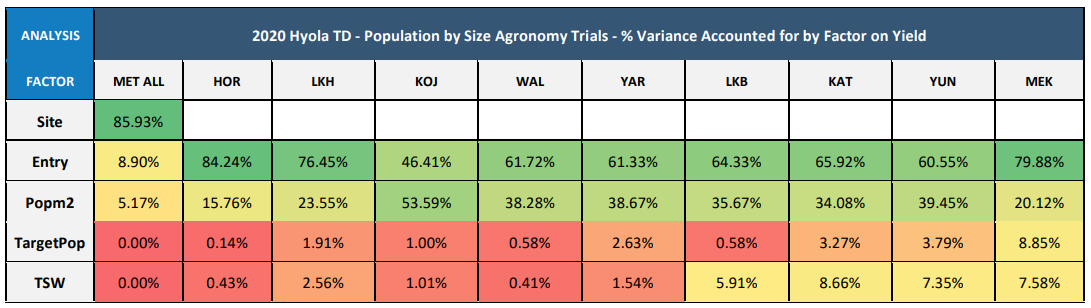
Table 5: 2020 MET Analysis for Grain Yield (t/ha) % Variance comparisons
Catalier (2019) found in some studies, canola yield increased with seeding rate (Harker et al 2012a, 75 and 150 seeds m2), and in other studies seeding rate did not influence yield (Kutcher et al., 2013). Gan et al. (2016) observed that yield response to seeding rates appeared to depend not only on environment, but what seeding rates or plant densities were being compared; lower seeding rates were more likely to show yield responses than higher seeding rates.
Yang et al. (2014) found seed yield increased with seeding rate, however leveled off at higher plant densities. With seed size, a yield benefit from larger canola seed was observed by Elliot et al. (2008) and Brill et al. (2016), while Harker et al. (2015), Clayton et al. (2009), Lamb and Johnson (2004) did not see a benefit of larger seed on canola yield.
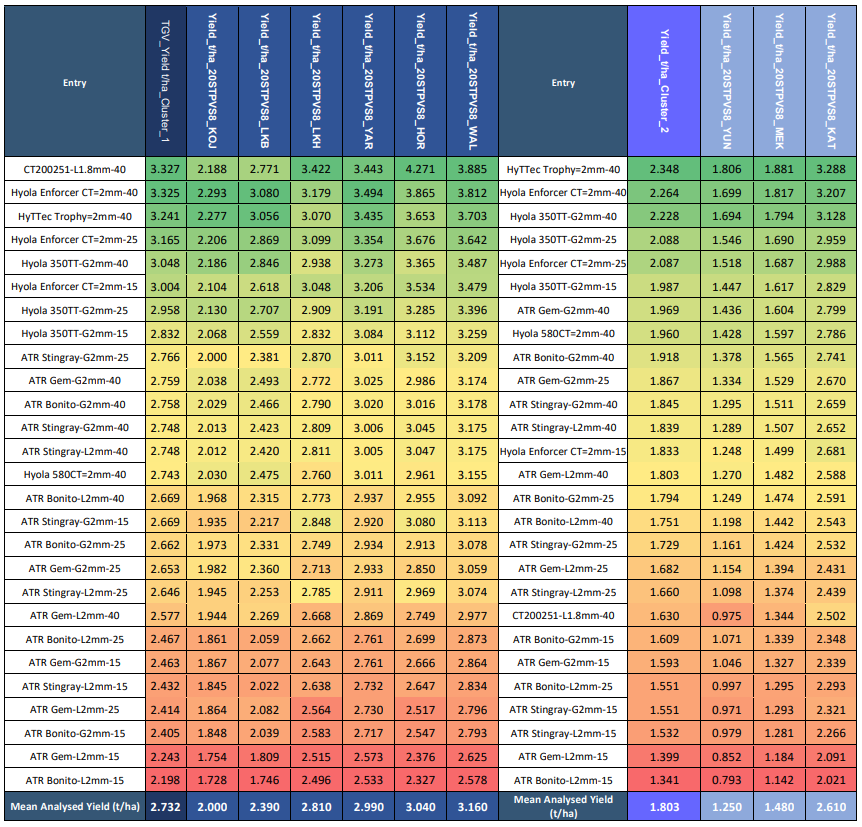
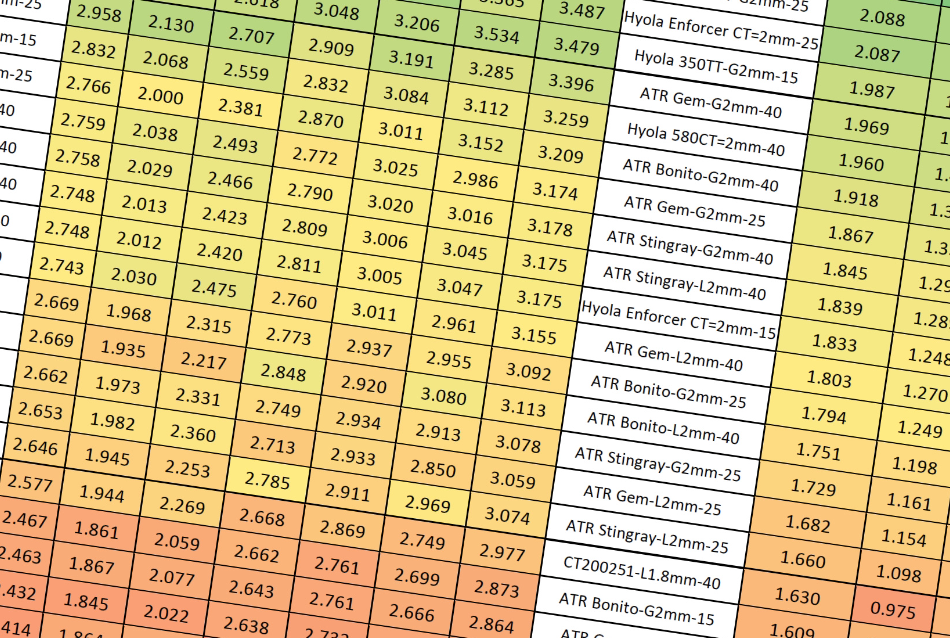
Table 6: 2020 MET analyses heatmap for all treatments grain yield across 9 trial environments in Australia
The MET analyses showed two distinct yield clusters broadly described as Cluster 1 being higher rainfall higher yielding and Cluster 2 as drier lower rainfall environments. Yields across both clusters showed CT® or TT hybrids with more widely adapted genetics, seed size =2mm or >2mm, providing the highest yields at 25 and 40 plants per m2 targets compared to any of the OP TT varieties regardless of plant population target or seed size.
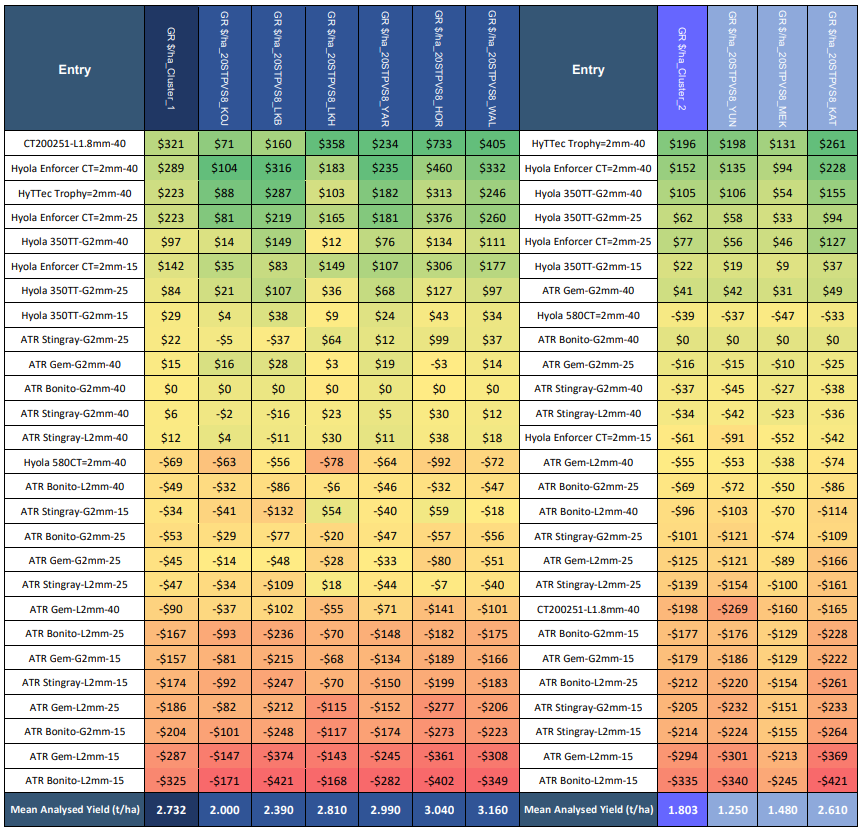
Table 7: 2020 MET analysed Heatmap for grain yield converted to Gross Returns $/ha expressed against baseline (Key Grower Option), open pollinated variety, ATR Bonito >2mm at 40 p/m2 target .
The gross return comparisons between hybrids and OP varieties were calculated using the most popular OP TT variety, ATR Bonito with >2mm seed size and at 40 plants per m2 target used as the baseline.
Some CT® and TT Hybrids between =2mm to >2mm seed size at the 25 or 40 plants per m2 targets compared to OP TT varieties with larger >2mm seed showed average gross return increases ranging between $84/ha to $321/ha in the higher rainfall environments and $36/ha to $196/ha in the medium rainfall environments.
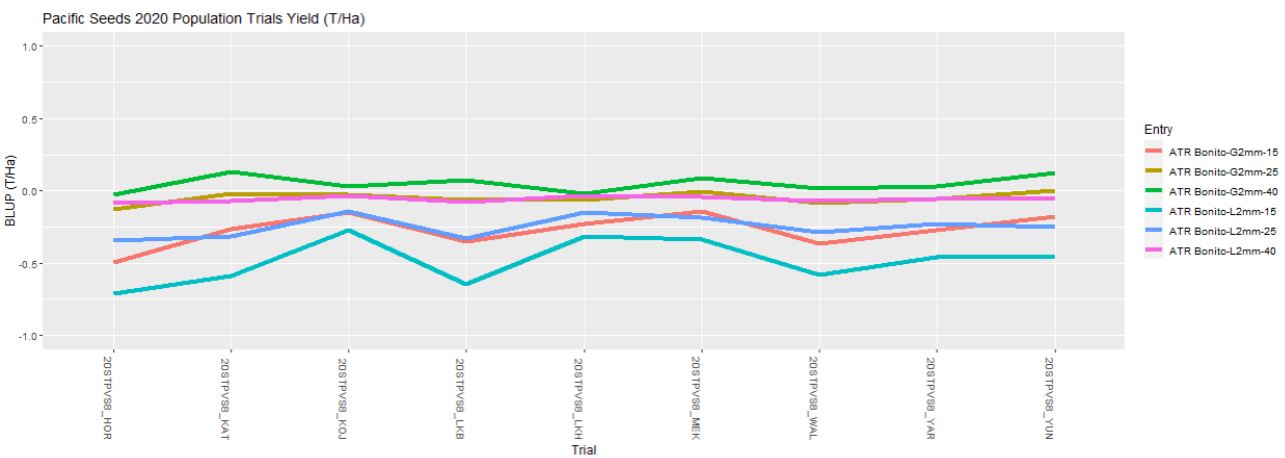
Graph 4: 2020 Analysed Grain Yield (t/ha) of ATR Bonito - OP TT >2mm vs <2mm seed size across 3 population targets
For ATR Bonito, when comparing seed size of >2mm vs <2mm, the G2mm size at 25 and 40p/m2 population targets provided the higher yield performance in all environments. The <2mm seed size at 40p/m2 showed yield equivalence with >2mm seed size at the 25p/m2 population target.
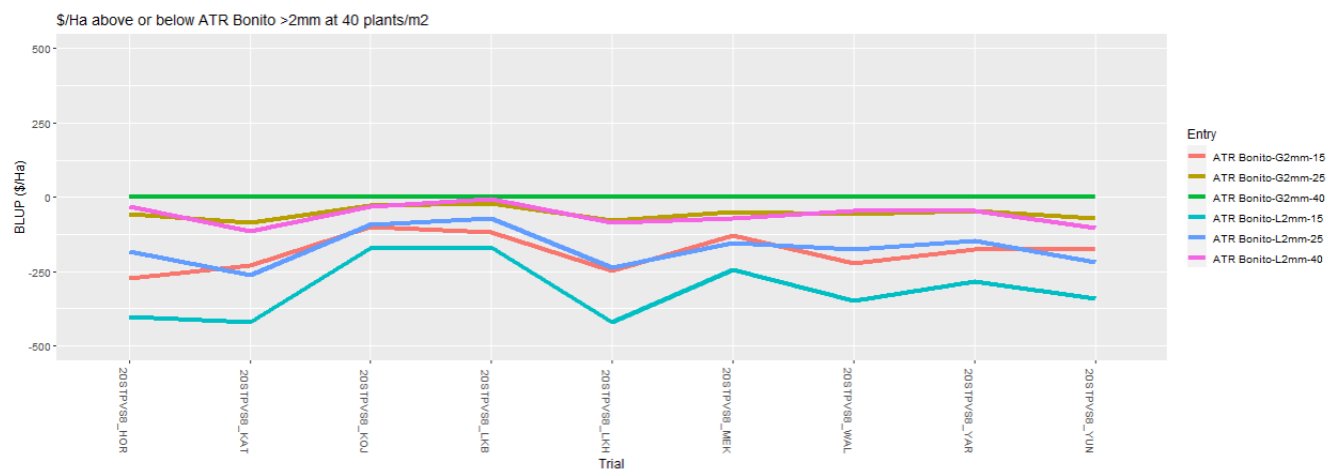
Graph 5: 2020 Gross return comparisons ($/ha) of ATR Bonito - OP TT >2mm vs <2mm seed size across 3 population targets
The gross return baseline was defined using ATR Bonito at >2mm seed size at 40p/m2 population target with provided the highest returns across all sites. Interestingly, ATR Bonito at G2mm seed size at the 25p/m2 target showed similar returns to the <2mm treatment at 40p/m2, demonstrating that savings related to sowing seed can be captured by growers using graded OP TT seed to >2mm size.
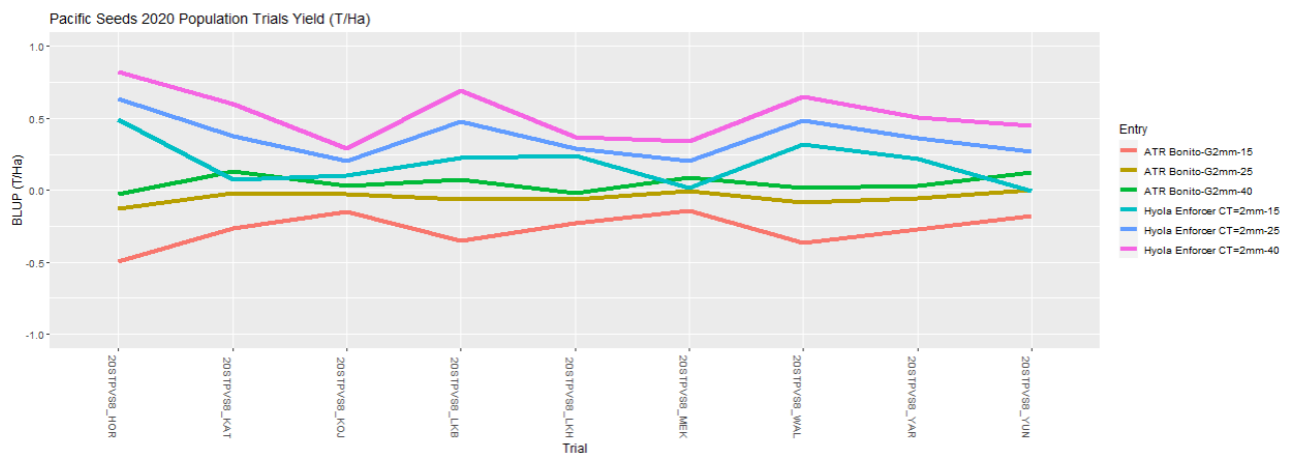
Graph 6: 2020 Analysed Grain Yield (t/ha) of ATR Bonito - OP TT >2mm vs Hyola Enforcer CT® =2mm seed size across 3 population targets
Hyola Enforcer CT® with =2mm seed size at 25 and 40p/m2 population targets provided higher yields even over ATR Bonito >2mm at 40p/m2 over all sites. Hyola Enforcer CT® with =2mm seed size at 15p/m2 demonstrated yields equal to, slightly below or higher than ATR Bonito >2mm at 40p/m2 target, depending on the individual environments.
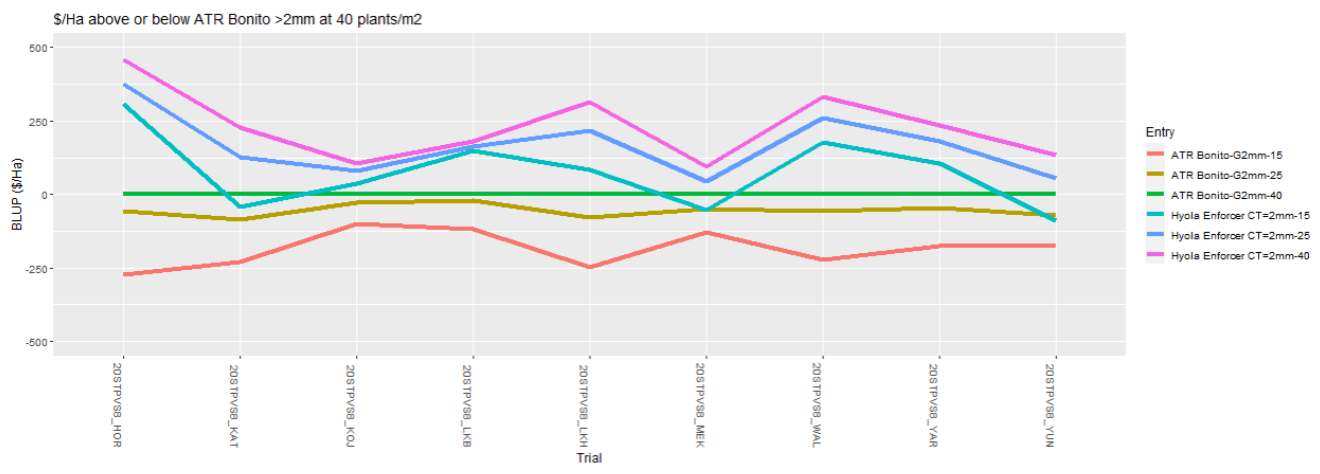
Graph 7: 2020 Gross return comparisons ($/ha) of ATR Bonito - OP TT >2mm vs Hyola Enforcer CT® =2mm seed size across 3 population targets
The gross return baseline was defined using ATR Bonito at >2mm seed size at 40p/m2 population target. Hyola Enforcer CT® at 25 and 40p/m2 population targets provided higher $/ha returns at all sites with the 15p/m2 population target providing higher returns at some individual higher rainfall locations.
Graph 8: 2020 Analysed Grain Yield (t/ha) of ATR Bonito - OP TT >2mm vs Hyola 350TT >2mm seed size across 3 population targets
Hyola 350TT with >2mm seed size at the 15, 25 and 40p/m2 population targets provided higher yields over ATR Bonito >2mm seed size at all 3 population targets over all 9 trial environments. ATR Bonito with >2mm seed size showed the highest yields at 40p/m2 over 25 and 15 p/m2 population targets across all trial sites.
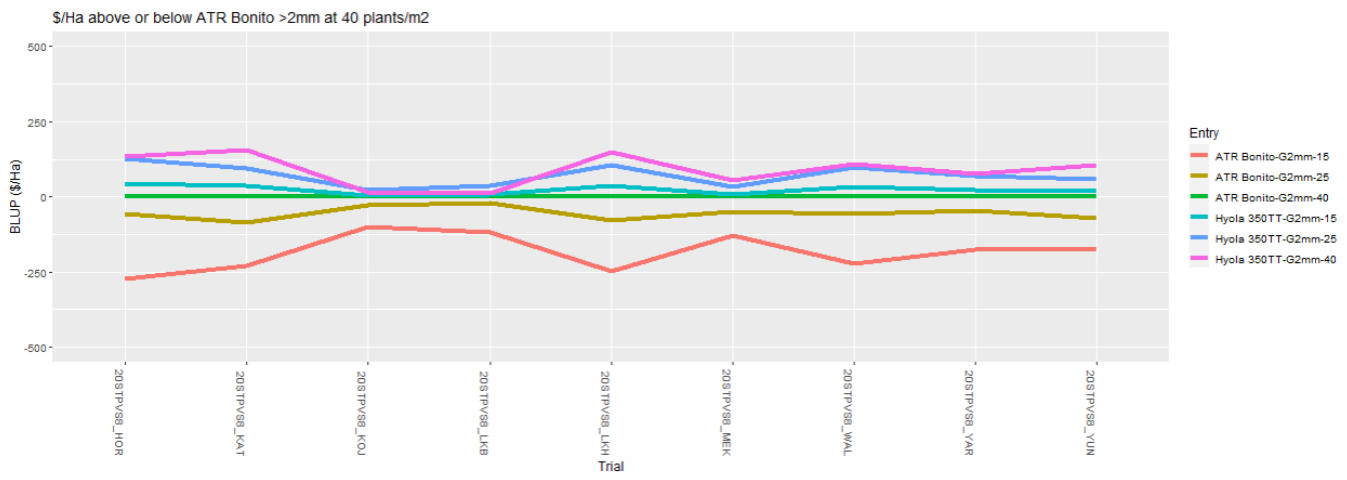
Graph 9: 2020 Gross return comparisons ($/ha) of ATR Bonito - OP TT >2mm vs Hyola 350TT >2mm seed size across 3 population targets
The gross return baseline was defined using ATR Bonito at >2mm seed size at 40p/m2 population target. Despite the higher seed costs associated with the larger hybrid seed, Hyola 350TT at 25 and 40p/m2 population targets provided higher $/ha returns at nearly all trial sites and importantly at the 15p/m2 target, provided similar gross returns to OP TT >2mm baseline at 40p/m2.
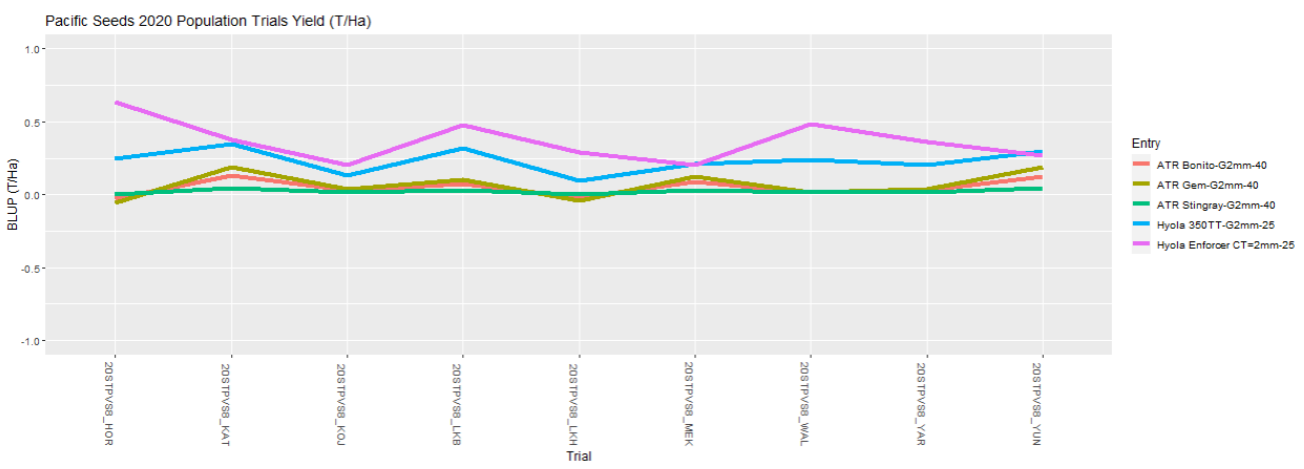
Graph 10: 2020 Analysed Grain Yield (t/ha) of 3 OP TT varieties with >2mm at 40p/m2 vs 2 hybrids =2mm and >2mm seed size at 25p/m2 across 3 population targets
The hybrids, Hyola Enforcer CT and Hyola 350TT at the 25 and 40p/m2 targets provided higher yields over all 3 OP TT varieties with >2mm at the 40p/m2 target over all yield environments.
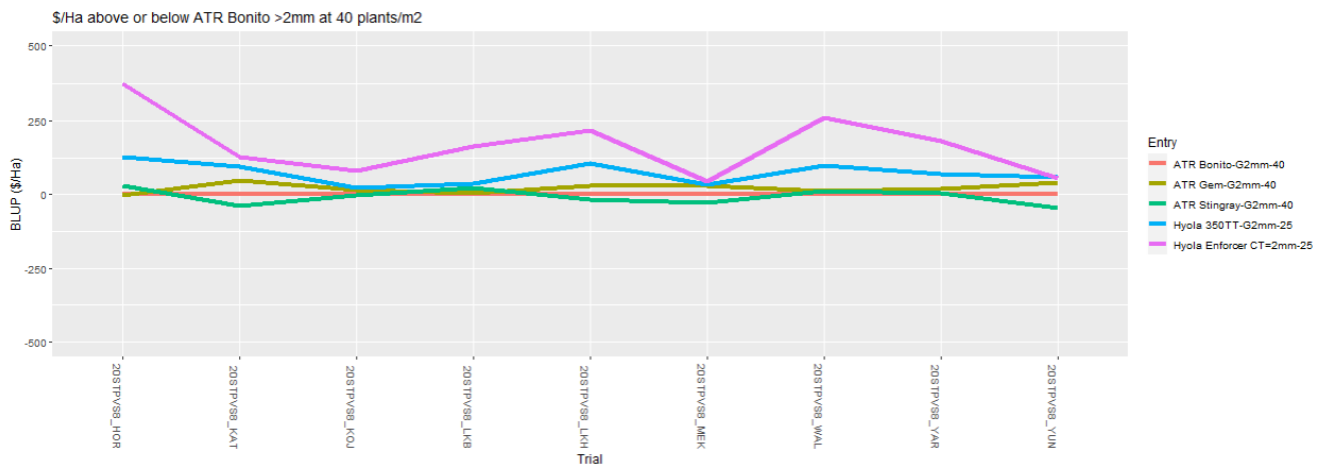
Graph 11: 2020 Gross return comparisons ($/ha) of 3 OP TT varieties with >2mm vs 2 hybrids =2mm and >2mm seed size across 3 population targets
The gross return baseline was defined using ATR Bonito at >2mm seed size at 40p/m2 population target. Hyola Enforcer CT at the 25p/m2 target provided higher $/ha returns at all sites compared to all 3 OP TT varieties with >2mm seed size at 40p/m2.
Despite the higher seed costs associated with the larger hybrid seed, Hyola 350TT at the 25p/m2 target population provided comparable to higher returns to all 3 OP TT varieties with >2mm seed size at 40p/m2 .
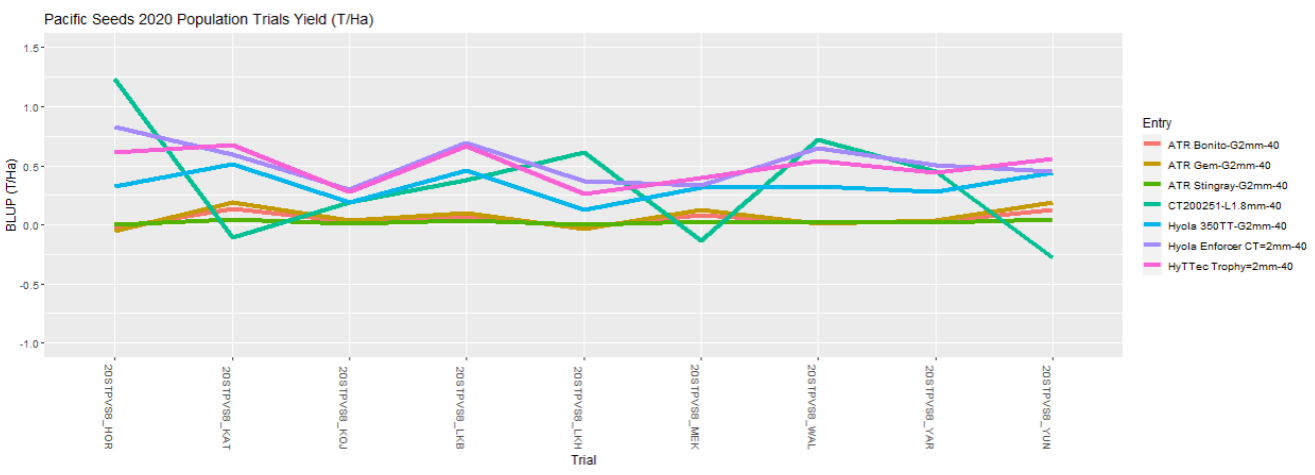
Graph 12: 2020 Analysed Grain Yield (t/ha) of 3 OP TT varieties with >2mm at 40p/m2 vs 4 hybrids ranging from (<1.8mm to >2mm) seed size at 40p/m2 across 3 population targets
3 of the 4 hybrids at 40p/m2 showed higher yields than all 3 OP TT varieties across all locations with many of these being many significantly higher. CT200251, a longer season experimental hybrid with <1.8mm small seed size at 40p/m2 showed very high yields in higher rainfall environments and yielded less competitively at individual lower yielding sites.
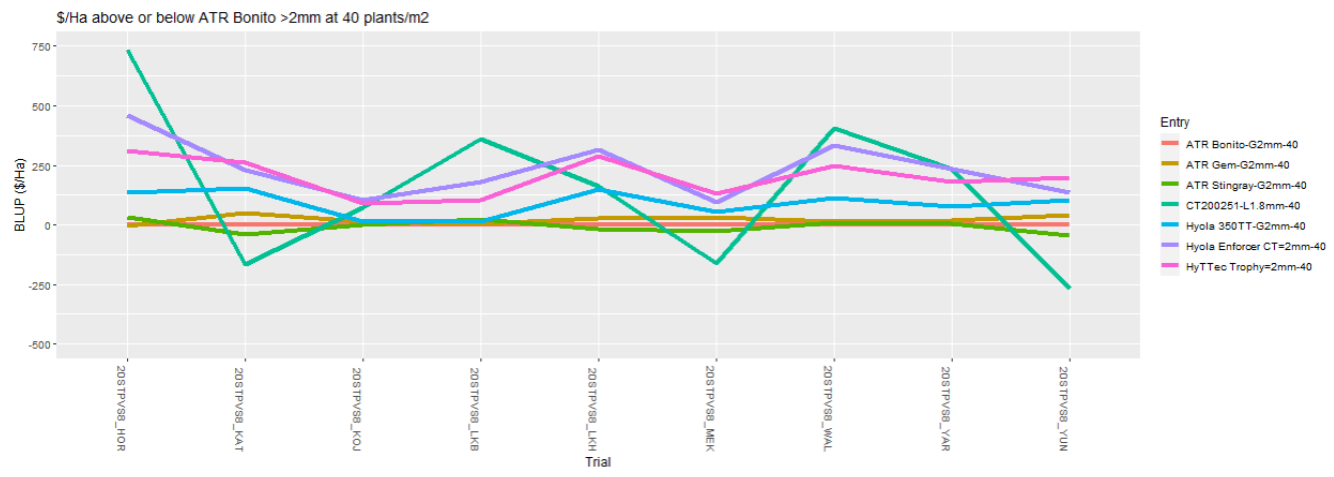
Graph 13: 2020 Gross return comparisons ($/ha) of 3 OP TT varieties with >2mm at 40p/m2 vs 4 hybrids ranging from (<1.8mm to >2mm) seed size at 40p/m2 across 3 population targets
Hybrids, Hyola Enforcer CT® and HyTTech® Trophy at 40p/m2 showed much higher gross returns than all 3 OP TT varieties at 40p/m2 across all sites, whereas 2 other hybrids showed varied gross return responses due to influences from background genetics, plant maturity, individual site rainfall, seed size and related sowing costs.
Conclusion
This study highlights that G X E X M interactions are very complex and dynamic. Genetics (G) is the biggest controllable factor, i.e. varietal choice; Environment (E) is the most significant factor by far. Management (M) will influence to a small degree in some environments, but for every environment where M has a significant effect, there are many environments where it does not. From a profitability perspective, the main consideration is “Genetics by Multi-Environment” relationships.
In relation to addressing canola growers industry ongoing requests for further research on validation of grading OP TT seed to >2mm, this research showed the >2mm seed across three OP TT “farmer sourced” varieties, increased plant establishment by up to 35 %, provided statistically significant yield increases of up to 433 kg per hectare and effectively lifted gross returns by up to $255 per hectare compared to the <2mm seed size.
Several CT® or TT hybrids across all 9 environments whether =2mm or >2mm seed size, demonstrated up to 35% higher establishment than all the OP TT varieties whether <2mm or >2mm seed size. Grain yields of several CT® or TT hybrids where significantly higher than all OP TT varieties irrespective of seed size, measured up to 560kg per hectare.
Whether the trial locations received a medium or high growing seasonal rainfall total, several CT® or TT hybrids, even with the lower plant population targets, provided higher gross returns in $ per hectare than all 3 OP TT varieties with the >2mm seed size in conjunction with the highest target population.
This effectively validates that CT® or TT hybrids with higher yielding genetic backgrounds now provide a strong positive value proposition in $ per hectare for canola growers by consistently providing higher returns than graded larger seed of farmer retained OP TT canola seed.
Key words
Canola, varieties, Hybrid, Triazine tolerant (TT), Clearfield + Triazine Tolerant (CT®), open pollinated, cultivar type, seed size, plant populations, seed-lots, plant height, grain yield, gross returns, value proposition.
Acknowledgments
2020 Trial Development, design and analysis by Dr David Tabah, Crop Research Lead (Canola), Advanta Seeds 2020 Trial planting, maintenance, spraying and harvest across Australia by Kalyx Australia, Synergy (SLR research & Extension), Crop Circle Consulting and TrialCo
References
Brill R., Jenkins M. L., Gardner M. J., Lilley J. M., Orchard B. A. (2016) Optimising canola establishment and yield in south-eastern Australia with hybrids and large seed. Crop and Pasture Science 67, 409-418.
Brill RD, Jenkins L, Gardner M (2014) Canola establishment; does size matter? In ‘Grains Research and Development Corporation Advisor Update.
Catellier C, (2019) M.Sc. P.Ag., Research Associate Optimal Seeding rate based on seed size in canola. Project #Carp SCDC 20 18-084, The Saskatchewan Canola Development Commission.
French RJ, Seymour M, Malik RS (2016) Plant density response and optimum crop densities for canola (Brassica napus L.) in Western Australia. Crop & Pasture Science 67, 397–408.
Gan Yantai, a K. Neil Harker, b H. Randy Kutcher, c Robert H. Gulden, d Byron Irvine, e William E. May, f John T. O'Donovanb, (2016) Canola seed yield and phenological responses to plant density, Canadian Journal of Plant Science 96(1): 151-159
Hanson BK, Johnson BL, Henson RA, Riverland NR (2008) Seeding rate, seeding depth, and cultivar influence on spring canola performance in the Northern Great Plains. Agronomy Journal 100, 1339–1346.
Harker KN, O’Donovan JT, Smith EG, Johnson EN, Peng G, Willenborg CJ, Gulden RH, Mohr R, Gill KS, Grenkow LA (2015) Seed size and seeding rate effects on canola emergence, development, yield and seed weight. Canadian Journal of Plant Science 95, 1–8.
Kudnig RJ, Tabah D, (2020) Exploring the effects of seed size and target plant densities on the yield of hybrid canola across Australia. 2020 Western Region GRDC Grains Research Updates.
Kutcher HR,1 T. K. Turkington,2 G. W. Clayton,3 K. N. Harker2 (2013) Response of herbicide-tolerant canola (Brassica napus L.) cultivars to four row spacings and three seeding rates in a no-till production system. Canadian Journal of Plant Science, 2013, 93(6): 1229-1236
Zhang H, Berger JD, Milroy SP (2013) Genotype × environment interaction studies highlight the role of phenology in specific adaptation of canola (Brassica napus) to contrasting Mediterranean climates. Field Crops Research 144, 77–88.
Zhang H, Berger JD, Seymour M, Brill R, Herrmann C, Quinlan R, Knell G (2016) Relative yield and profit of Australian hybrid compared with open-pollinated canola is largely determined by growing-season rainfall. Crop & Pasture Science 67, 323–331
Paper reviewed by
Dr David Tabah, Crop Research Lead (Canola) – Advanta Seeds Australia