Download The

2022-23 Pacific Seeds Hyola agronomy - canola technology by populations research results
Optimising the value proposition when comparing canola varieties and different herbicide technologies against multiple population targets.
Key messages:
- Hybrid cultivars consistently outperformed OP (open pollinated) varieties in plant establishment, grain yield, and economic returns across herbicide technologies. Environmental conditions emerged as the primary influencing factor across multiple environments
- CT® and TT hybrids with elevated genetic yield potential matched yields and returns of TruFlex®, TruFlex + Clearfield®, or Clearfield hybrids in specific environments
- Significant yield improvements were evident when moving from 15 to 40 plants/m².
- Gross returns varied with population targets, seed prices, and GM (genetically modified) vs. non-GM grain commodity price differentials. Higher populations often led to improved returns, as depicted in figures and tables.
Aims
This study investigates differences between different canola herbicide technologies concerning plant establishment (plants/
m²), harvested grain yield (tonnes/ha), and oil %. 14 distinct hybrid cultivars are compared against 2 open-pollinated (OP) TT
varieties (purchased seed source), with the aim of identifying optimal gross returns ($/ha) for growers.
Introduction
Australian canola growers and advisors seek comprehensive scientific insights on variety performance, at different population targets, while taking into account diverse herbicide technologies and hybrid vs OP varieties. This imperative arises due to the industry’s rapid expansion of herbicide-tolerant hybrids, including GM and non-GM stacked options, necessitating optimal agronomic and financial strategies.
This study examines 14 hybrids alongside 2 OP TT varieties, focusing on plant establishment, grain yield, and oil % production. The aim is to determine best gross return ($/ha) propositions. The research encompasses 3 population targets and evaluates different genetic backgrounds, herbicide-tolerant technologies, and their interactions on yield, oil %, and gross returns.
Previous published literature has identified varying results. In 24 experiments conducted across a range of agricultural environments in Western Australia between 2010 and 2014, French et al. (2016) reported grain yield response to crop density was adequately described by an asymptotic model (where yield approaches but never quite reaches a ceiling at very high density). Zhang et al. (2016) demonstrated that relative yield and profit of an Australian hybrid compared with open-pollinated canola is largely determined by growing-season rainfall which forms a key component of environment (E).
This research, conducted across 3 Western Australian locations, compares 6 herbicide technologies (single trait or stacked) against 3 population targets. It seeks to explore genetics (G) by environment (E) by management (M) interactions.
Method
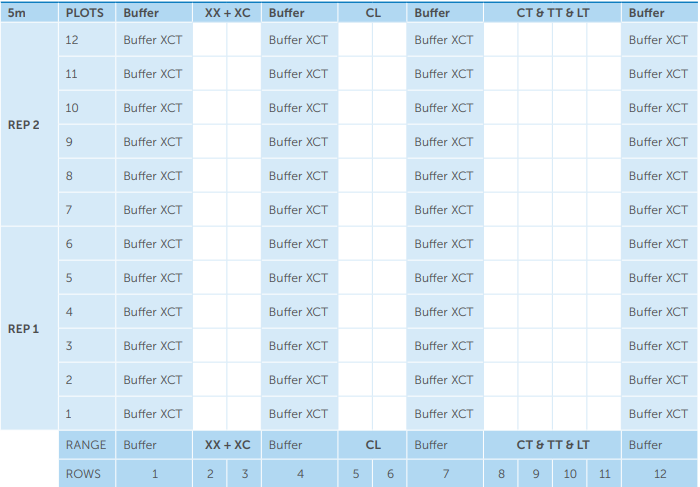
3 field research extension sites were established in Western Australia: Lake Hinds WA (CND), Tammin WA (TMN), and Corrigin WA (COR), each with a layout organised as randomised complete blocks with two replicates (RCB x 2 replicates, refer to figure 1 for trial layout and treatment list). These selected trial environments showcased diverse conditions encompassing seasonal rainfall, cropping histories, soil types, and soil pH. The trials encompassed a combination of both best management practice (BMP) and district standard practice (DSP) treatments for each location, providing a rich array of data points for meticulous comparative analysis (refer to table 1-3 and graphs 1-3).
A total of 16 canola varieties were subjected to comparison within this study. This set included 2 open-pollinated TT, 3 hybrid TT, 2 hybrid CT®, 1 hybrid LT, 4 hybrid CL, 1 hybrid XC®, and 3 hybrid TruFlex lines, categorised within their respective technology groups. These comparisons spanned 3 distinct target population treatments, specifically 15 plants per m², 25 plants per m², and 40 plants per m². These targets were calculated based on 90% germination and an estimated 75% establishment survival, necessitating adjustments in all seed packet weights. The corresponding effective sowing rates were 1.1 kg/ha, 1.8 kg/ha, and 2.85 kg/ha. The herbicide tolerance technologies under consideration encompassed CT (Clearfield + triazine tolerant), triazine tolerant, Liberty + triazine tolerant, Clearfield, TruFlex + Clearfield, and TruFlex.
Trial Design
2022 HYOLA TD - SYSTEMS POPULATION TRIALS (22STAGVL6)
Hyola systems population trials - overall design entries by treatment
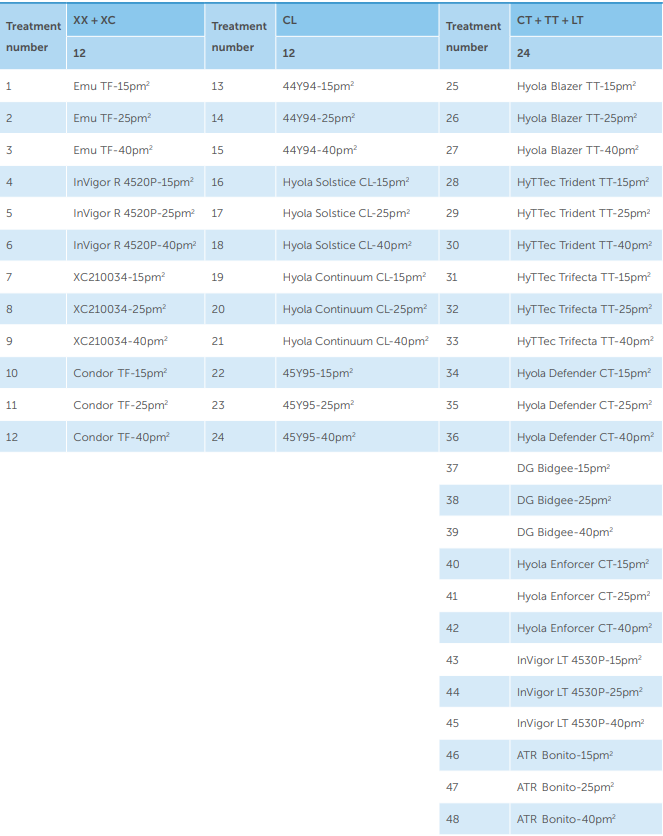
Figure 1. Replicated trial layouts showing technology blocks and treatment listings for each environment.
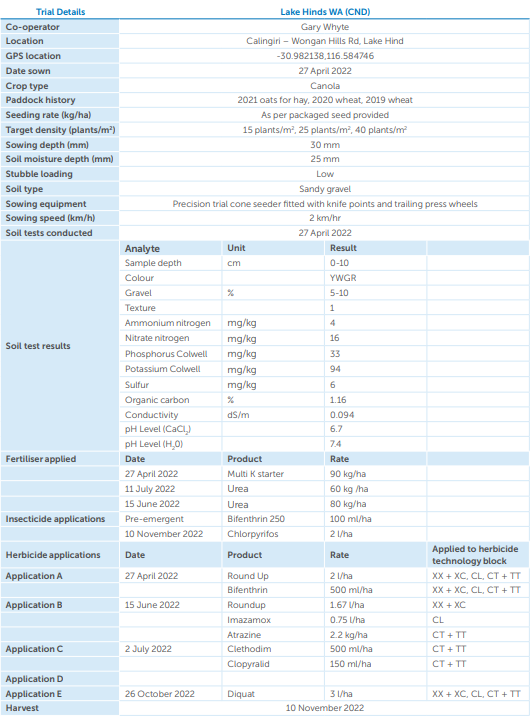
Table 1: 2022 Lake Hinds WA trial details and agronomic management.
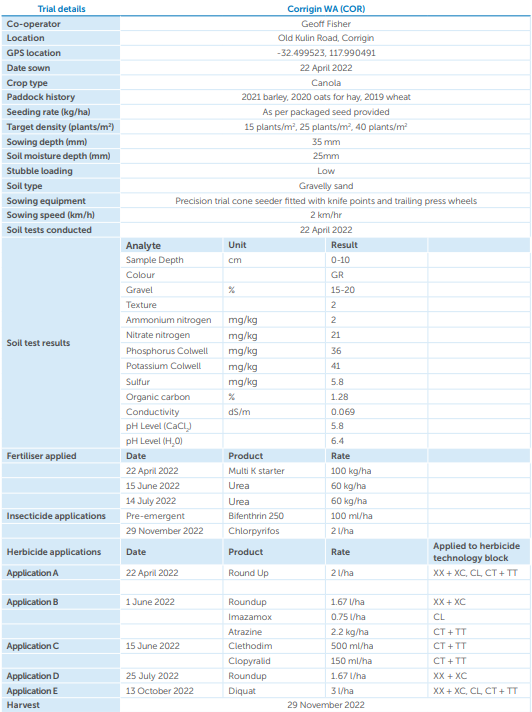
Table 2: 2022 Corrigin WA trial details and agronomic management.
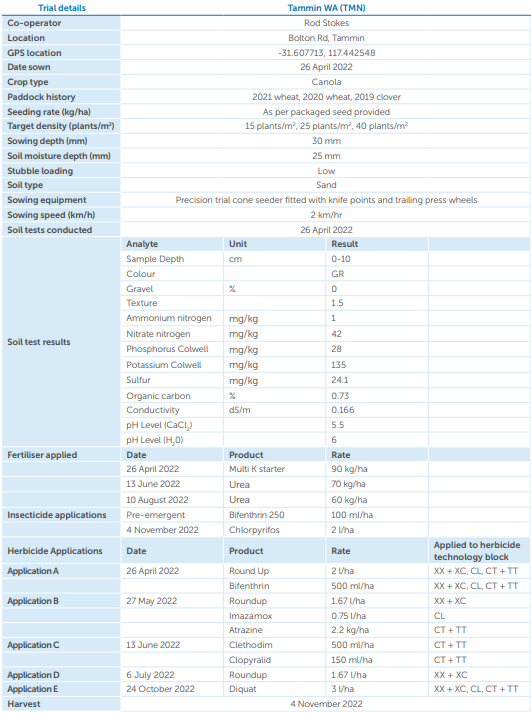
Table 3: 2022 Tammin WA Trial Details and Agronomic Management.
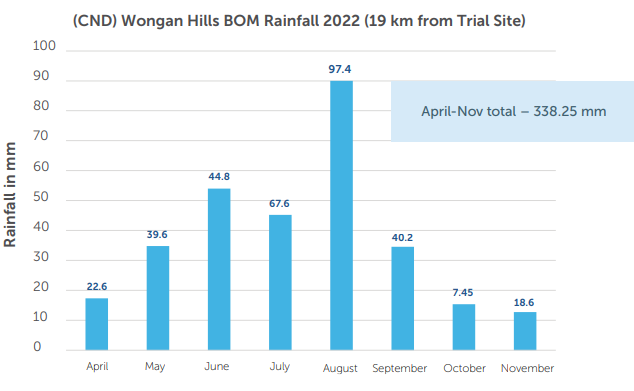
Graph 1: 2022 Wongan Hills (Lake Hinds) WA rainfall data
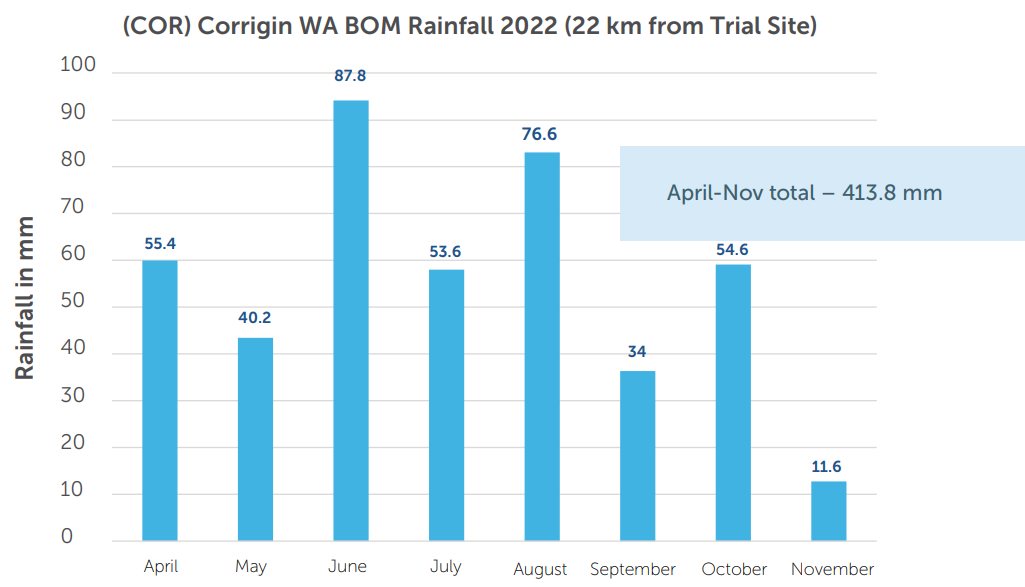
Graph 2: 2022 Corrigin WA rainfall data.
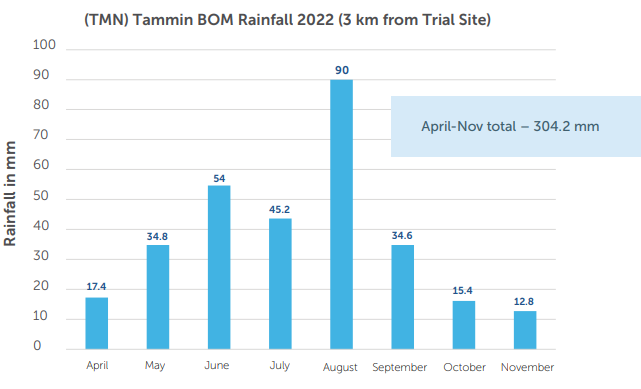
Graph 3: 2022 Tammin WA rainfall data.
The assessment encompassed comprehensive measurements across all replicates and environments. Plants per m² were quantified through 4x1m row counts per plot, performed at 14 days after sowing (DAS) and 28 DAS. These measurements were further validated by stem counts post-harvest, accompanied by visual subjective vigour ratings at the 4-6 leaf stage, in addition to visual maturity ratings at both flowering and maturity stages.
Quantification of grain yield (t/ha) occurred using plot harvesters, while oil % was gauged employing near-infrared spectroscopy (NIR). Gross return calculations used foundational assumptions from Table 4.
Population, yield, and oil % analyses for individual sites were meticulously executed. This involved fitting entry, IPP (Popm2), and TargetPop as fixed linear factors, complemented by spatial adjustments implemented through the auto-regressive model. This framework yielded best linear unbiased estimators (BLUE) outputs for each site. The statistical framework employed ASReml (Gilmour et al. (2010)).
A deeper exploration of yield entailed the application of single step factor analytic MET (multiple environment trial) analysis. Here, the model integrated plants/m2 as a linear fixed factor alongside composite entry as a random factor, culminating in best linear unbiased predictors (BLUP) for each site. Spatial adjustments were determined via the auto-regressive model. The MET analysis discerned significant GxExM effects. As a statistical reference, ASReml was employed, aligning with the framework established by Gilmour et al. (2010).
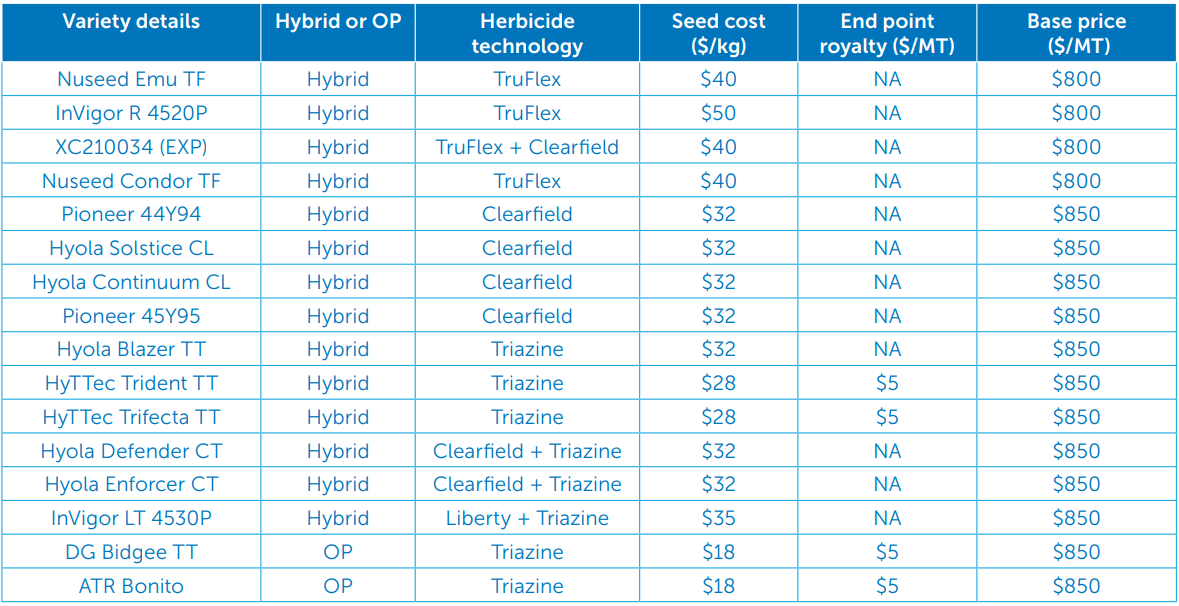
Table 4: 2022 variety details and gross return foundation assumptions.
Results and discussion
French et al. (2016) noted canola field establishment ranging from 0.3 to 1, with greater rates at lower target densities and a median of 0.585 at 40 plants/m². In this study, variety mean field establishment spanned 0.35 to 1.26 (15 plants/m²), 0.31 to 1.24 (25 plants/m²), and 0.23 to 1.2 (40 plants/m²).
Graphs 4 and 5 depict relationships for Clearfield, TruFlex + Clearfield, and TruFlex hybrids between actual plant populations and harvested grain yields. Some hybrids positively responded to increased plant numbers, while others plateaued or showed no response. Experimental hybrid XC210034 consistently displayed rising yield responses with increased plant populations across all locations.
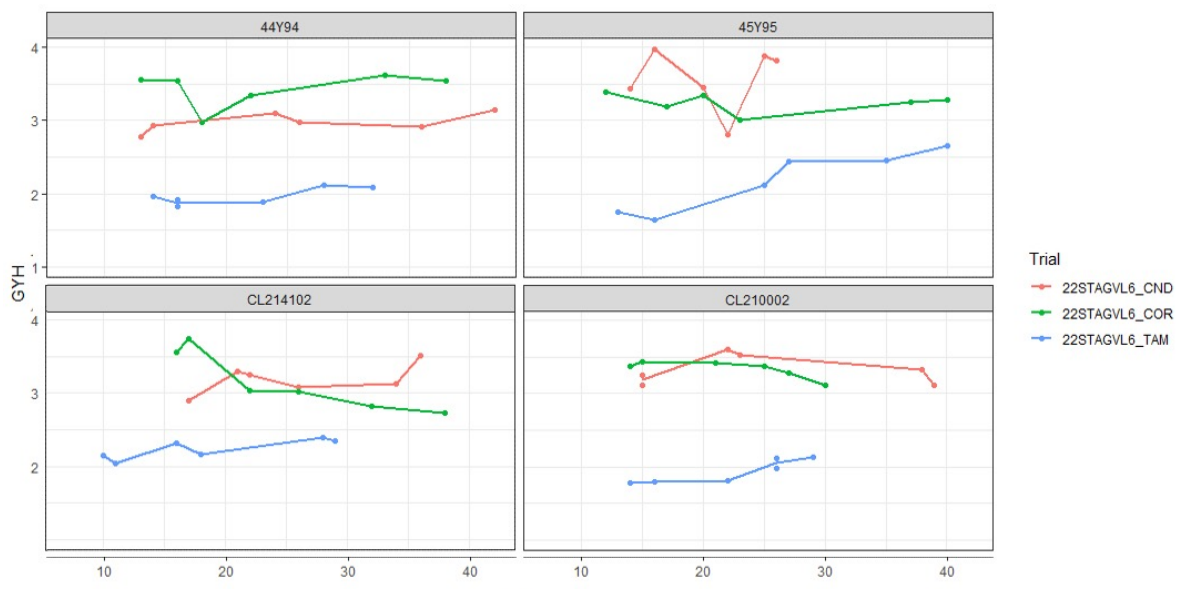
Graph 4: 2022 grain yield relationships by actual plant populations achieved compared for Clearfield hybrids.
CL214102 is now commercially release as Hyola Solstice CL.
CL210002 is now commercially released as Hyola Continuum CL.
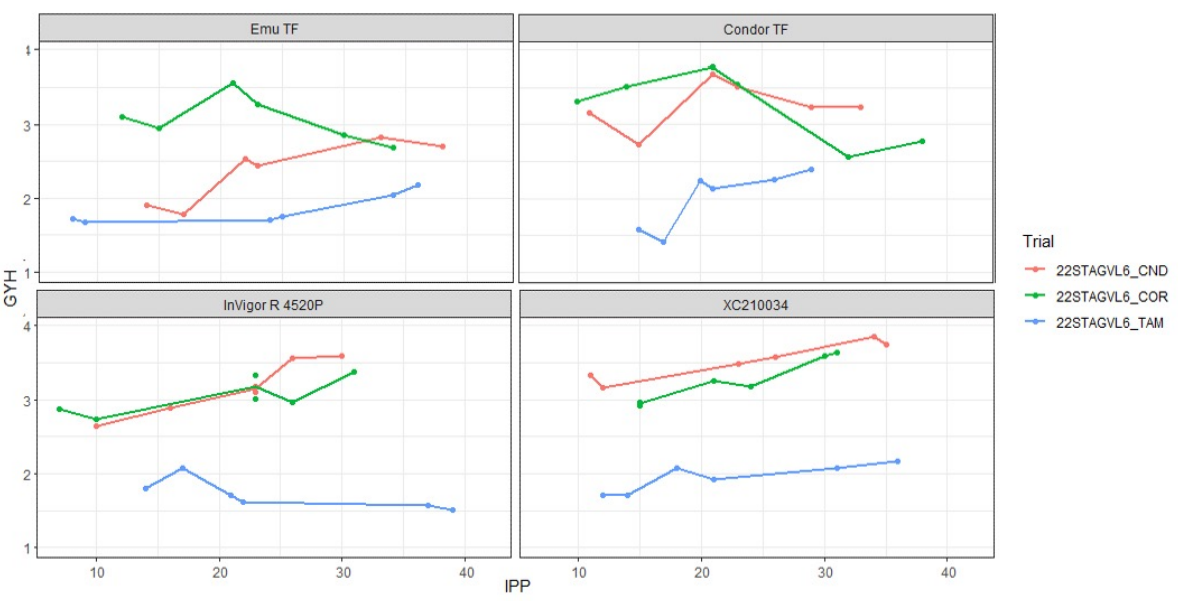
Graph 5: 2022 grain yield relationships by actual plant populations achieved compared for TruFlex and TruFlex
+ Clearfield stacked hybrids.
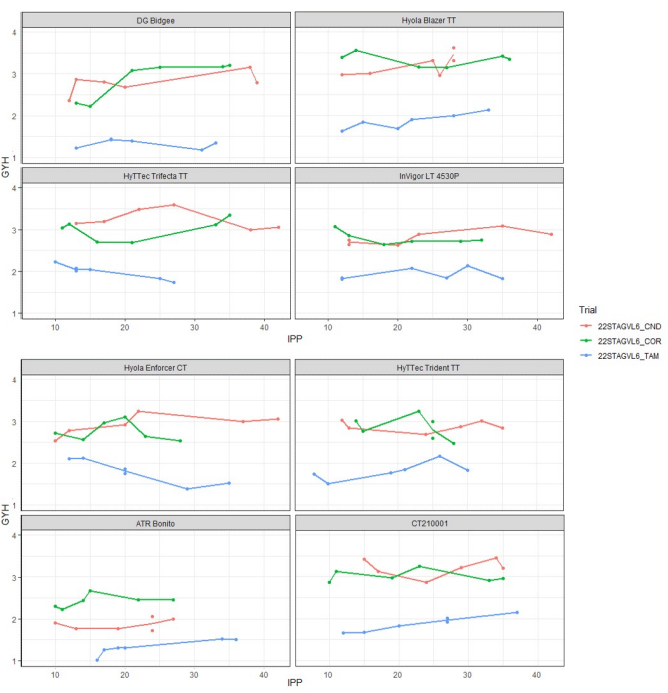
Graph 6: 2022 grain yield relationships by actual plant populations achieved compared for triazine and triazine + Clearfield stacked hybrids, Liberty + triazine stacked hybrid vs open pollinated TT varieties. CT210001 is now commercially released as Hyola Defender CT.
Graph 6 illustrates relationships for Clearfield + triazine, triazine, and Liberty + triazine hybrids, as well as OP triazine varieties, showcasing actual plant populations and harvested grain yields.
Experimental line CT210001 (Hyola Defender CT) and OP variety DG Bidgee TT responded positively to increased plant numbers, yielding more in specific locations. ATR Bonito and InVigor LT4530P displayed more of a flat-lined response in certain locations.
Hyola Enforcer CT showed negative yield responses in some locations with increasing plant numbers. Hybrids generally outperformed OP variety ATR Bonito TT in yield at most sites. Newer OP variety DG Bidgee TT demonstrated better overall performance relative to hybrids in higher yielding environments.
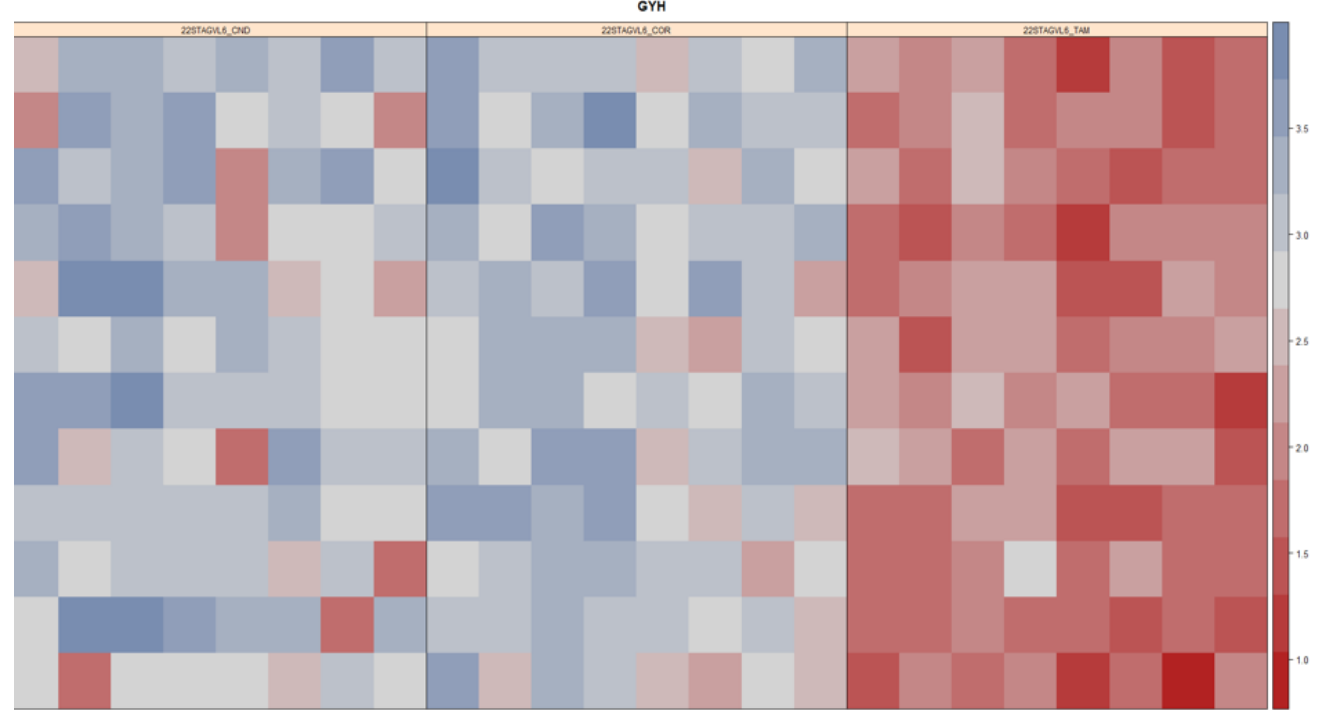
Figure 2: Heat maps of analysed grain yields of all varieties and technologies at each of the 3 trial locations. LHS represents CND Trial, then the COR Trial in the center with the TMN Trial on the RHS.
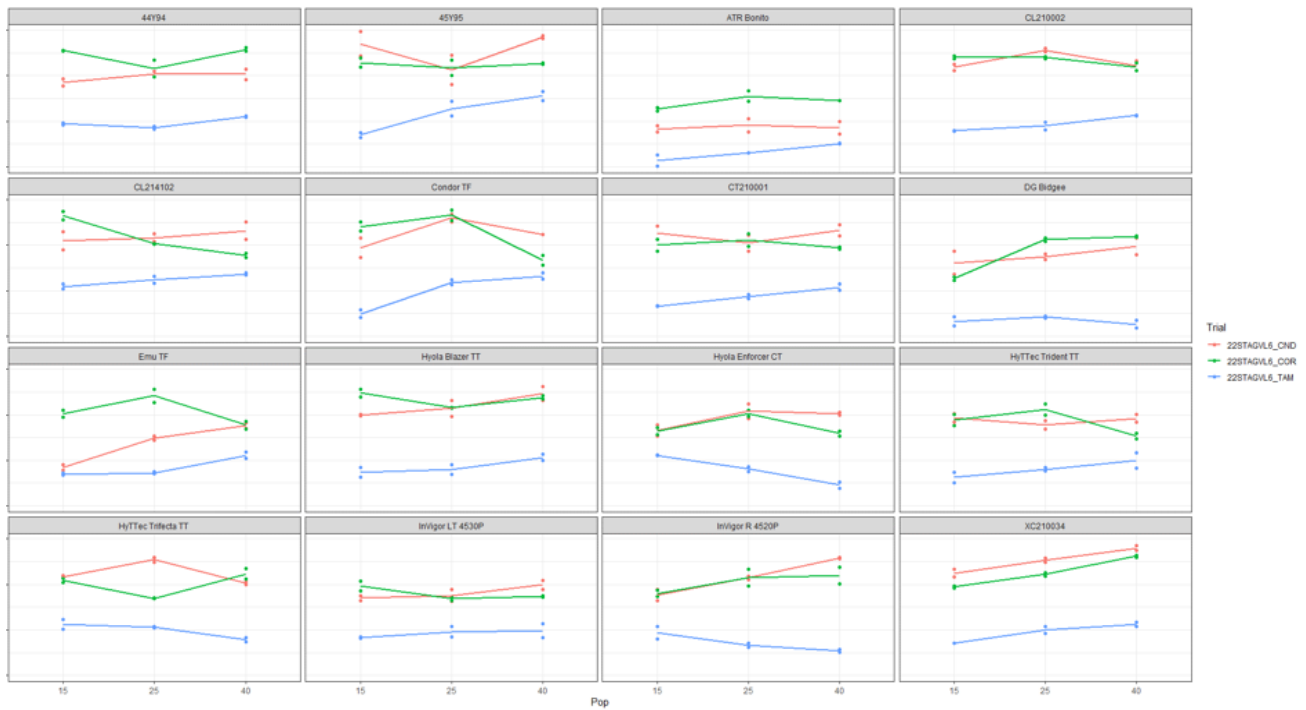
Graph 7: 2022 grain yield relationships by plant population targets compared for all herbicide technologies across all 3 environments. CL214102 is commercially released as Hyola Solstice CL, CL210002 is commercially released as Hyola Continuum CL and CT210001 is commercially released as Hyola Defender CT.
Photo 1: 2022 Corrigin WA Hyola technology by population Trial XX, XC herbicide Section.
Graph 7 illustrates the correlation between grain yield and plant population targets. Varieties exhibited diverse responses: some positive, some neutral, and others negative due to environmental influences.
French et al. (2016) found slight differences in optimal densities for hybrid and open-pollinated cultivars. High rainfall zones had approximately 10 plants/m² higher optimal densities than low and medium rainfall zones.
Catalier (2019) reported mixed findings: yield increased with seeding rates in some studies (Harker et al., 2012a, 75 and 150 seeds/m²), but not in others (Kutcher et al., 2013).
Gan et al. (2016) noted yield responses to seeding rates were influenced by environment and the specific rates or densities compared; lower seeding rates were more likely to show yield responses than higher rates.
This research identified E as the primary factor influencing grain yield responses across all 3 locations, followed by genetics (Table 5). G x E and G x IPP (Population) x E interactions contributed less to variance.
At individual sites, G often explained a significant percentage of variation, followed by G x IPP. IPP had the least impact on variance accountability across locations.
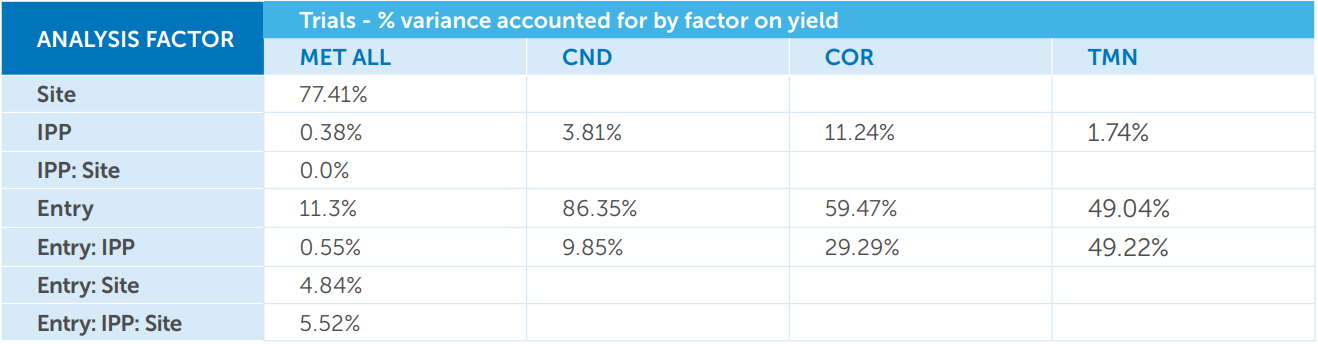
Table 5: 2022 MET analysis for grain yield (t/ha) showing % variance factors comparisons where IPP = Plant population, Entry = (G) Genetics, and Site = (E) Environment.
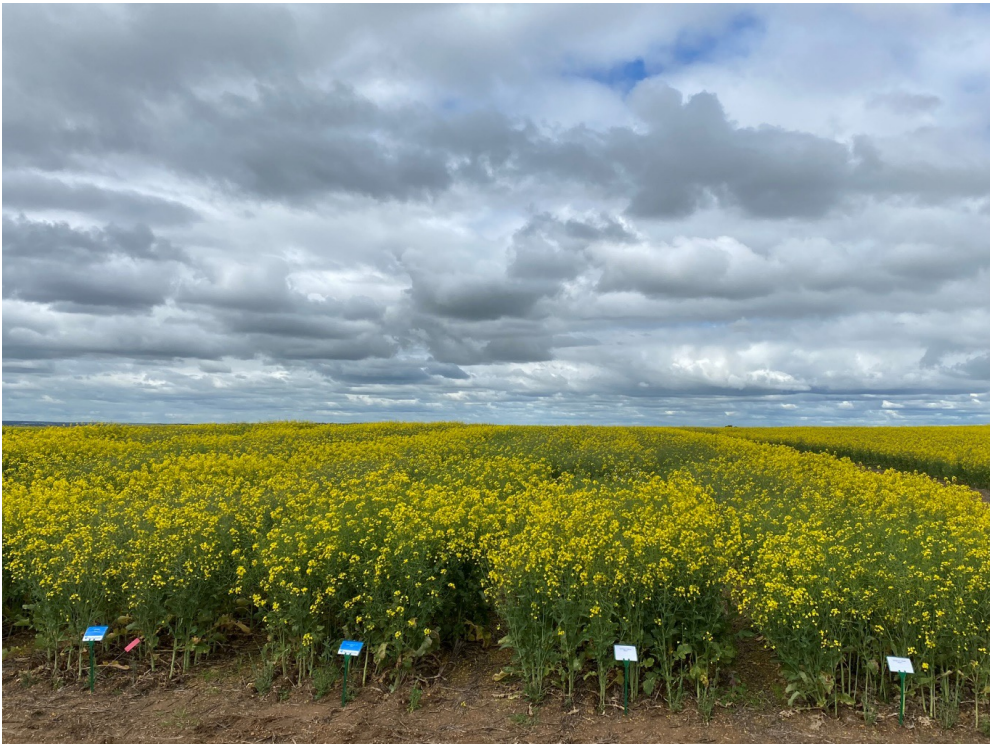
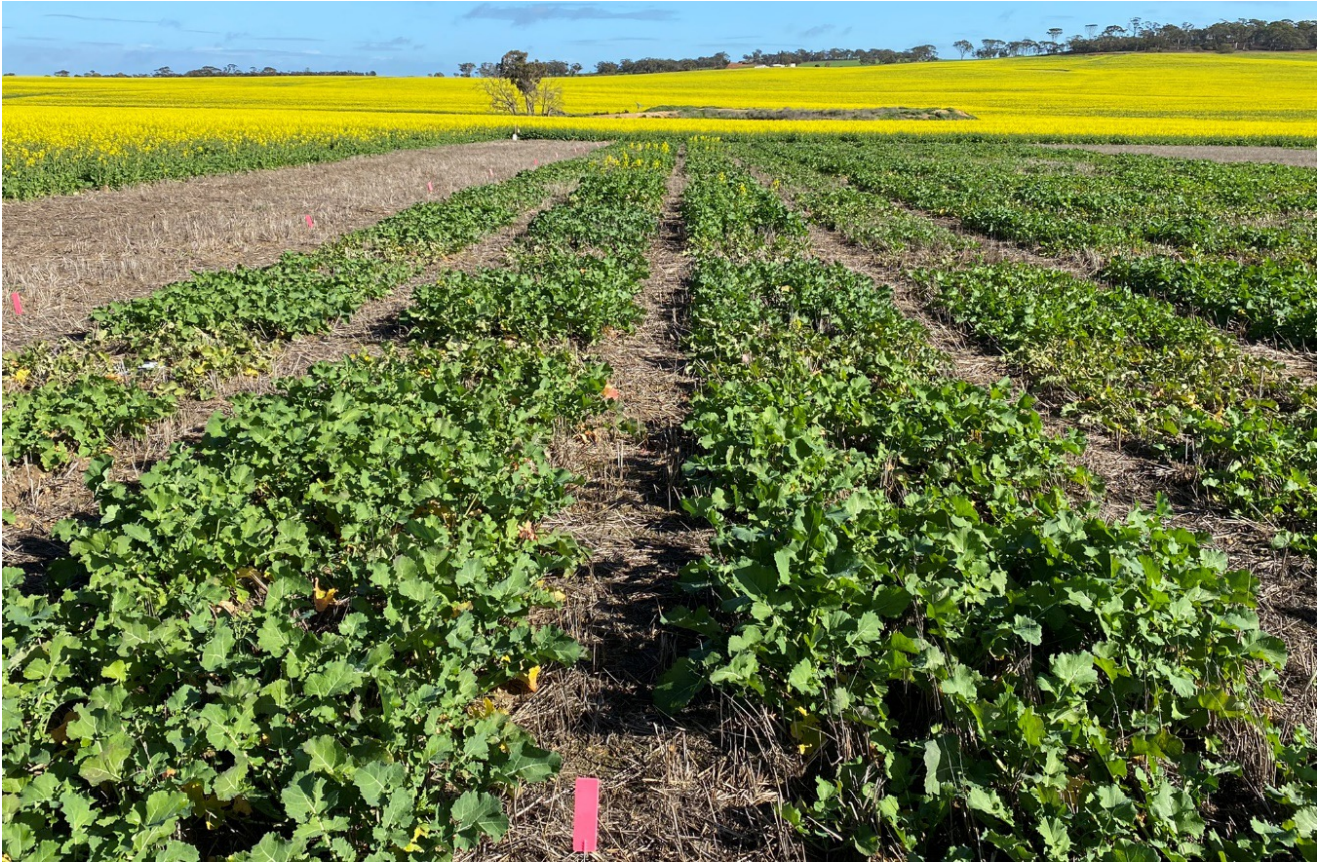
Photo 2: 2022 Lake Hinds WA Hyola technology by population trial CT, TT and LT herbicide Section.

Table 6: 2022 statistical analysis heatmap for all treatments mean grain yield (t/ha) and oil % across 3 trial environments in Western Australia
For the single site analyses within the Clearfield technology group (Table 6), the four hybrids demonstrated relatively stable and competitive grain yield performance, with only a few cases where higher populations didn’t yield higher results. However, some of these instances of higher yields for different varieties with increased populations were not statistically significant. Oil % relationships often did not display a significant response across the various variety population targets.
In the TruFlex and TruFlex + Clearfield technology group, the four hybrids exhibited strong environmental responses to each other in terms of grain yield. Condor TF and XC210034 consistently demonstrated the highest and most consistent yield outcomes across the 3 locations. The variety Emu TF became more competitive for grain yield in lower rainfall environments (TMN) at higher population levels, where its earlier maturity phenology suited the prevailing environmental conditions. Similar to the prior cases, some of these instances of higher yields for different varieties with higher populations were not statistically significant. Oil % relationships also often did not show a significant response across the various variety population targets.
Within the Clearfield + triazine, triazine, Liberty + triazine hybrids, as well as OP triazine group, the hybrids displayed strong environmental responses to each other for grain yield. Hyola Blazer TT, HyTTec Trifecta, CT210001, and HyTTec Trophy consistently demonstrated the highest and most consistent yield outcomes across the 3 locations. Hyola Enforcer CT and InVigor LT 4530P exhibited moderate yield responses across locations, with the OP varieties often displaying the lowest yield responses. The OP TT variety DG Bidgee TT demonstrated enhanced competitiveness for grain yield in higher rainfall environments (CND & COR), where its phenology suited the softer environmental conditions. Similar to the previous cases, some of these instances of higher yields for different varieties with higher populations were not statistically significant. Oil % relationships also often did not show a significant response across the different variety population targets.
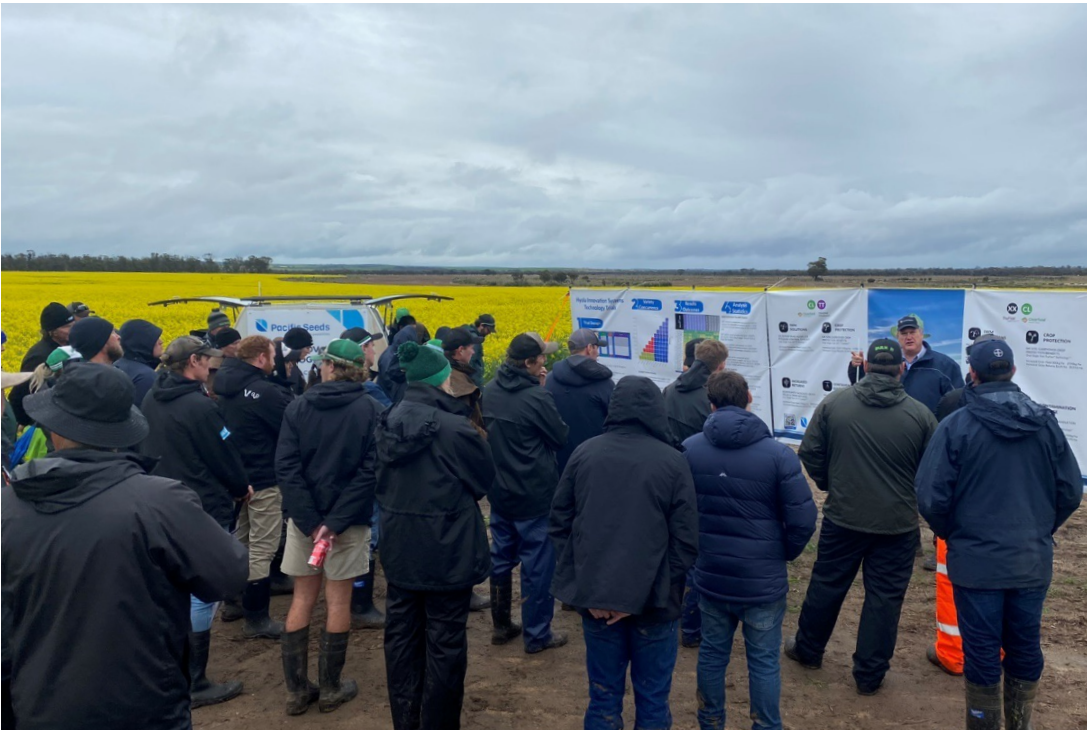
Photo 3: 2022 Tammin WA Hyola technology by population trial with Western Australian agronomists listening to technical extension presentations at the site during flowering stages.
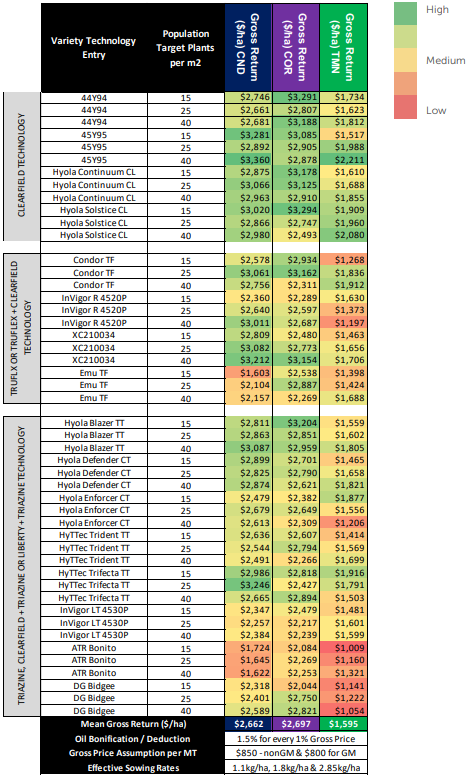
Table 7: 2022 statistical analysis heatmap for grain yield (t/ha) and mean oil % converted to gross returns $/ha across 3 trial
environments in Western Australia.
The gross returns were calculated using the assumptions from Table 4. The Clearfield, TruFlex + Clearfield, and TruFlex hybrids often exhibited the highest returns across all 3 locations (Table 7). However, Hyola Blazer TT and CT210001 also demonstrated competitive gross returns relative to the Clearfield, TruFlex + Clearfield, and TruFlex hybrids at certain locations.
The top 10 hybrids frequently displayed gross returns within the range of $2500 to $3500, while the two OP (OP) varieties yielded gross returns ranging from $1009 to $2821 across various population treatments and locations.
Increased population targets of hybrids often did not result in significantly higher gross returns compared to lower plant population targets due to the higher costs associated with seed prices. The gross returns of genetically modified (GM) hybrids were also influenced by the grain price differential between non-GM and GM commodities.
The new XC and CT hybrid technologies showcased the capacity to yield and provide competitive gross returns, comparable to single tolerance technologies like TruFlex, Clearfield, and triazine tolerant hybrids. Oil % results generally exhibited higher values for TruFlex, Clearfield, and TruFlex + Clearfield technologies (Table 6), which had a more pronounced positive impact on gross returns when contrasted with the lower Oil % values of the two OP varieties.
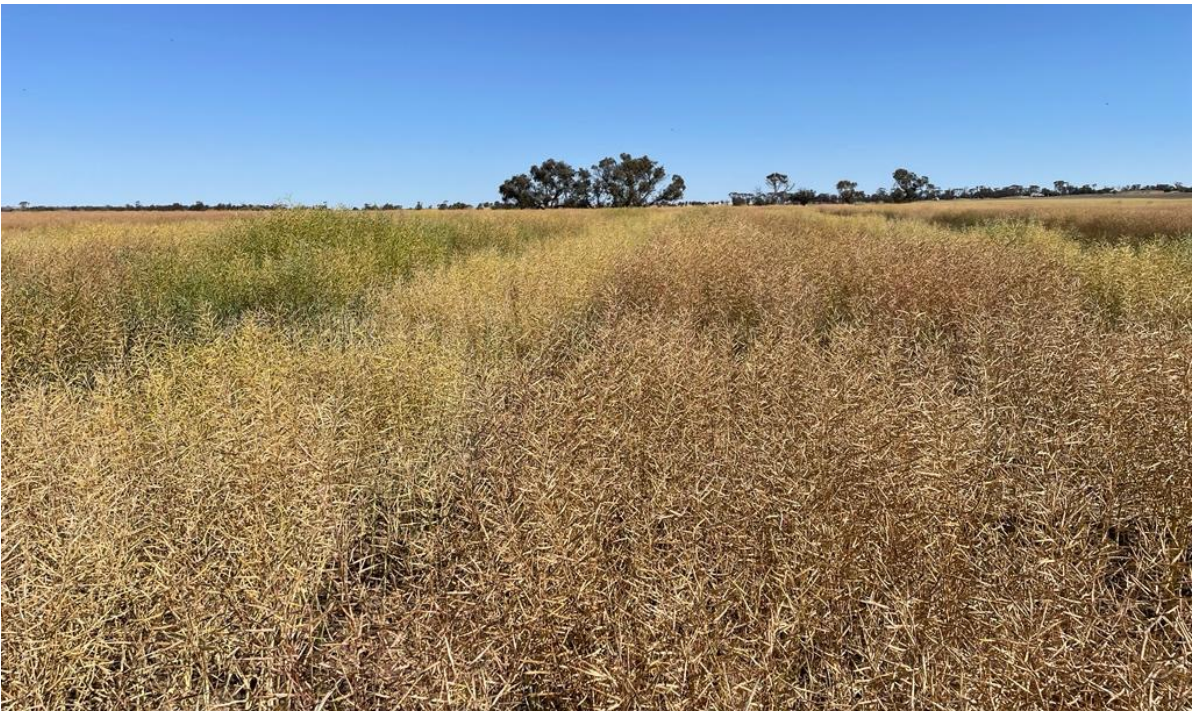
Photo 4: 2022 Tammin WA Hyola technology by population trial CL herbicide section.
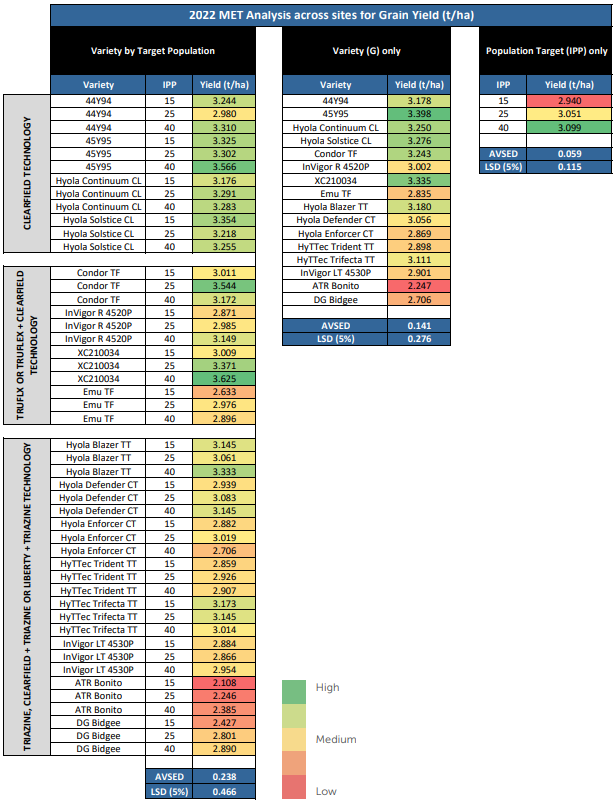
Table 8: 2022 MET analysis heatmap for grain yield (t/ha) showing variety x population interaction, variety and population responses across 3 trial environments in Western Australia.
The MET site analyses (Table 8) of variety (G) by population targets indicated variable responses among different varieties.
Within the Clearfield, TruFlex, and TruFlex + Clearfield technology groups, one out of the 8 hybrids displayed a significant positive response between 15 plants and 25 plants per m² population targets. Another hybrid out of the 8 exhibited a significant positive response between 15 plants and 40 plants per m² population targets.
Within the Clearfield + triazine, triazine, and Liberty + triazine hybrids, as well as the OP triazine group, no significant response was observed across the 3 sites for increased plant populations.
The MET site analyses of G only, indicated no significant difference between the four Clearfield hybrids for grain yield. Some significant differences emerged between TruFlex and TruFlex + Clearfield hybrids, although Condor TF and XC210034 exhibited no significant difference. In the TT, CT & LT technology group, notable differences existed between hybrids and OP varieties, with HyTTec Trifecta TT, Hyola Blazer TT, and CT210001 yielding the highest across all 3 sites.
The MET analysis of population target only demonstrated a significant yield increase from 15 plants per m² to 40 plants per m².
Conclusion
These comparisons of canola varieties with 6 different herbicide technologies (single trait or stacked) at 3 population targets across 3 locations in Western Australia have yielded valuable insights into how strong E can impact final agronomic and economic performance.
This research underscores the findings of Kudnig (2021), which determined that G X E X M interactions are exceedingly complex and dynamic. G stands as the most significant controllable factor, i.e., varietal choice; E, on the other hand, emerges as the most influential and least controllable factor. In this context, M and plant population exert a minor influence in certain environments, yet for every environment where M significantly affects outcomes, there are many where it doesn’t.
From a profitability perspective, the primary consideration is the “genetics by multi-environment” relationships.
Regarding G, irrespective of varying herbicide technologies, whether single or stacked, the genetic yield potential of the base germplasm remains a pivotal factor influencing yield, oil, and gross return outcomes at individual locations. However, across multiple locations, E takes precedence as the main driver.
CT or TT hybrids with higher-yielding genetic backgrounds now present a strong positive value proposition in terms of $ per hectare for canola growers in specific environments. In comparison, XX, XC, and CL technologies largely offer consistently adapted performance and returns.
The two OP TT varieties evaluated often displayed significantly lower yields and oil content, resulting in the lowest gross returns in many population treatment comparisons, especially against most of the different herbicide-tolerant technology hybrids.
Key words
Canola, varieties, Hybrid, CT, Clearfield + triazine tolerant, triazine tolerant, Liberty + triazine tolerant, Clearfield, XC, TruFlex + Clearfield, TruFlex, open pollinated, cultivar type, plant populations, grain yield, gross returns, value proposition.
Acknowledgments
2022 Trial development, design and analysis by Willow Liddle, R&D Research Assistant (Canola), Advanta Seeds 2022 Trial planting, maintenance, spraying and harvest across Western Australia by Synergy (SLR research & Extension).
References
Brill R., Jenkins M. L., Gardner M. J., Lilley J. M., Orchard B. A. (2016) Optimizing canola establishment and yield in southeastern
Australia with hybrids and large seed. Crop and Pasture Science 67, 409-418.
Brill RD, Jenkins L, Gardner M (2014) Canola establishment; does size matter? In ‘Grains Research and Development
Corporation Advisor Update.
Catellier C, (2019) M.Sc. P.Ag., Research Associate Optimal Seeding rate based on seed size in canola. Project #Carp SCDC 20
18-084, The Saskatchewan Canola Development Commission.
French RJ, Seymour M, Malik RS (2016) Plant density response and optimum crop densities for canola (Brassica napus L.)
in Western Australia. Crop & Pasture Science 67, 397–408.
Gan Yantai, a K. Neil Harker, b H. Randy Kutcher, c Robert H. Gulden, d Byron Irvine, e William E. May, f John T. O’Donovanb,
(2016) Canola seed yield and phenological responses to plant density, Canadian Journal of Plant Science 96(1): 151-159
Hanson BK, Johnson BL, Henson RA, Riverland NR (2008) Seeding rate, seeding depth, and cultivar influence on spring canola
performance in the Northern Great Plains. Agronomy Journal 100, 1339–1346.
Harker KN, O’Donovan JT, Smith EG, Johnson EN, Peng G, Willenborg CJ, Gulden RH, Mohr R, Gill KS, Grenkow LA (2015)
Seed size and seeding rate effects on canola emergence, development, yield and seed weight. Canadian Journal of Plant
Science 95, 1–8.
Kudnig RJ, Tabah D, (2020) Exploring the effects of seed size and target plant densities on the yield of hybrid canola across
Australia. 2020 Western Region GRDC Grains Research Updates.
Kudnig RJ, (2021) Optimizing the Gross Return value proposition when comparing Farmer Retained OP TT vs Hybrid CT®
and TT canola with varying seed sizes and plant population targets. 2021 Western Region GRDC Grains Research Updates.
Kutcher HR,1 T. K. Turkington,2 G. W. Clayton,3 K. N. Harker2 (2013) Response of herbicide-tolerant canola (Brassica napus L.)
cultivars to four row spacings and three seeding rates in a no-till production system. Canadian Journal of Plant Science, 2013,
93(6): 1229-1236
Zhang H, Berger JD, Milroy SP (2013) Genotype × environment interaction studies highlight the role of phenology in specific
adaptation of canola (Brassica napus) to contrasting Mediterranean climates. Field Crops Research 144, 77– 88.
Zhang H, Berger JD, Seymour M, Brill R, Herrmann C, Quinlan R, Knell G (2016) Relative yield and profit of Australian hybrid
compared with open-pollinated canola is largely determined by growing-season rainfall. Crop & Pasture Science 67, 323–331.
Paper reviewed by
Mr. Justin Kudnig, National Technical Canola Manager – Pacific Seeds Australia — a Subsidiary of Advanta Seeds.
Disclaimer
The information provided in this publication is intended as a guide only. Advanta Seeds Pty Ltd (including its officers, employees, contractors and agents) (‘Advanta Seeds’) can not guarantee that every statement is without flaw of any kind. While Advanta Seeds has taken all due care to ensure that the information provided is accurate at the time of publication, various factors, including planting times and environmental conditions may alter the characteristics and performance from plants. Advanta Seeds shall not be liable for any errors or omissions in the information or for any loss, injury, damage or other consequence whatsoever that you or any person might incur as a result of your use of or reliance upon the products (whether Advanta Seeds products or otherwise) and information which appear in this publication. To the maximum extent permitted by law, the liability of Advanta Seeds for any claim whatsoever arising out of the supply or use of or reliance upon the products and information in this publication (including liability for breach of any condition or warranty implied by the Trade Practices Act 1974 or any other law) is limited at its discretion, to the replacement of the products, the supply of equivalent products or the resupply of the publication. For application to specific conditions, seek further advice from a local professional. ©Advanta Seeds 2023.