Download The

What did we learn?
- Using retained seed or a mix of new and retained seed results in poorer gross margins than using new seed.
- Planting retained seed results in poorer establishment, irrespective of herbicide tolerance.
Across canola growing regions of Australia in 2023, 18 sites were analysed to see if it made financial sense to sow retained seed (F2) or a combination of new and retained seed (F1-F2) rather than sowing new hybrid seed (F1). Six hybrid varieties of differing herbicide tolerances were grown at each site.
What was the establishment like?
Figure 1: Plant establishment was significantly better using new seed and there was no difference between using a blend of new and retained seed or just using retained seed.
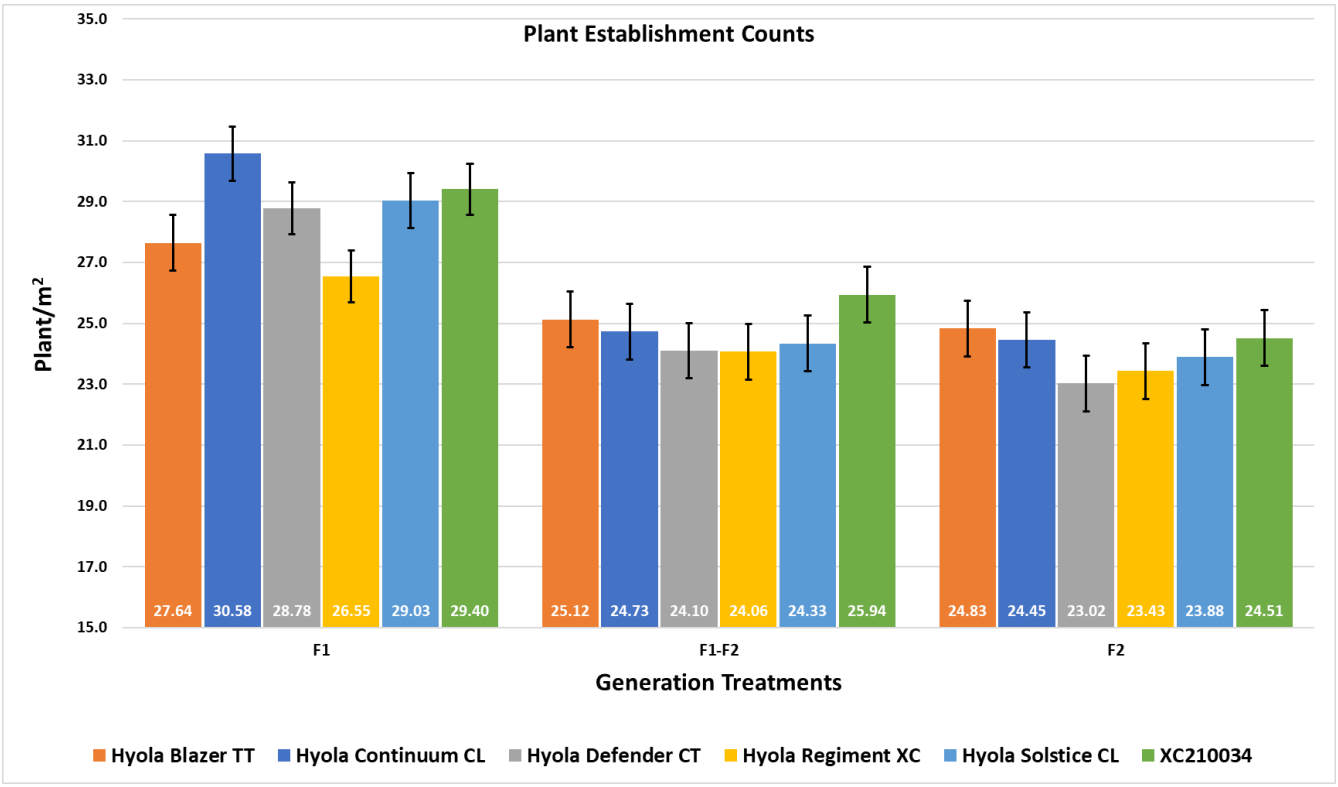
Note: F1 = New seed and F2 = Retained seed
Targeted plant densities for each site was 40 plants/m2 and the establishment for the new seed treatments was significantly better than the blended and retained seed treatments. There was no benefit in mixing new and retained seed to improve establishment compared to just using retained seed. To achieve the same plant density of the new seed treatments, the seeding rate would have to be increased which increases the cost.
What about the gross margins?
Figure 2: The simplified gross margin for Hyola Regiment was greater than the blend treatments which was greater than the retained seed treatments across 18 sites.
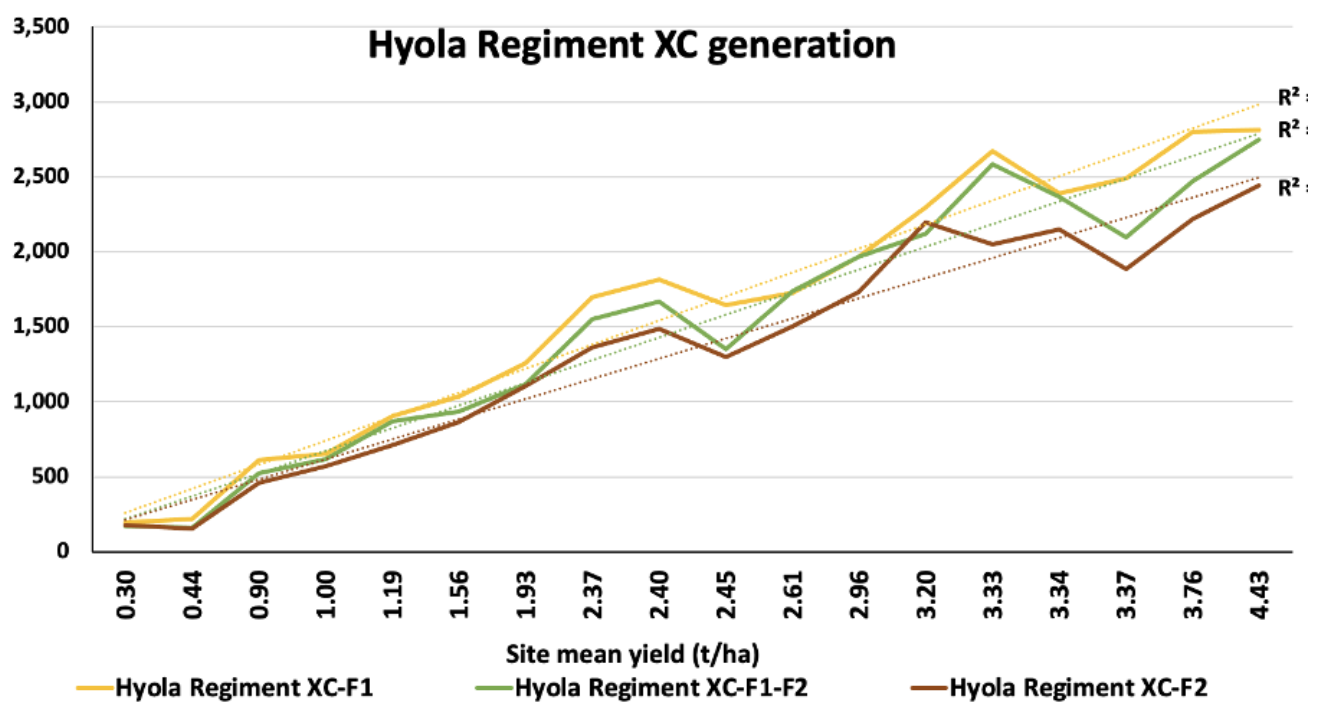
Note: Simplified gross margin = Grain yield x grain price – estimated seed cost. F1 = New seed and F2 = Retained seed
In general, as the site mean yield increases, so does the gross margin of F1 seed compared with F2 or an F1-F2 blend. Interestingly, there is minimal or no difference between treatments at very low yielding sites, however in these regions once all costs were considered it is questionable whether it is economic to grow canola.
To access the full report, download the research.
Agronomic and financial outcomes associated with retaining seed
across both Spring and Winter canola hybrids.
Andrew Heinrich and Willow Liddle, Pacific Seeds, Perth, and Toowoomba.
Key Words
Canola Hybrid, F1, F2, F3, generations, yield depression. maximising grower returns, retained seed, dry matter production,
genetic segregation.
Key messages
- Spring F1 hybrid canola seed produces significantly higher grain yields across a range of diverse environments than
either a 50:50 blend of F1-F2 seed and retained F2 generation seed. - Planting retained Spring F2 seed leads to reduced effective plant establishment, irrespective of the herbicide
tolerance. - Planting retained Spring hybrid canola in a 50:50 blend of F1-F2 or F2 generation seed reduces economic returns to
the grower across a majority of growing environments. - Planting retained Winter F2 and F3 canola generations led to decreased dry matter production, harvested grain
yield and gross returns when compared to the F1 hybrid.
Aims
This research examines the differences in plant establishment, grain yield, and economic returns when comparing F1 hybrid Spring canola seed to a 50:50 F1-F2 blend and F2 retained seed.
In specific reference to Winter type canola, field comparisons were made to determine grain yield, dry matter production and economic returns of F1 hybrid seed versus F2 and F3 generation retained seed.
Introduction
Australian canola growers and agricultural advisors have been seeking increased scientific information and recommendations around retaining F2 seed from hybrid canola crops and its impact on plant establishment, grain yield and resulting income. Five hybrid varieties and one experimental hybrid were assessed that have a range of either single or stacked herbicide tolerances.
Previous outcomes of industry research and field trial observations both in Australia and overseas describe the segregation process of plants from Hybrid F1 to F2 generations and the agronomic implications to farmers. The more inbred the parents are, the higher the heterosis or hybrid vigour in the F1 generation and the greater the yield decline from F1 to F2 (Hartmann, 2006). Retaining hybrid seed compromises plant vigour, disease resistance and herbicide tolerance (Craig 2013).
Winter type canola is utilised by growers for dual-purpose cropping in Graze and Grain systems. Growers have been retaining F2 and F3 generation seed as a means of reducing input costs in an attempt to improve profitability. The relationship between generation versus dry matter production and grain yield was examined in detail during this research.
Reduction in Winter canola grain yield and dry matter production has been clearly demonstrated in previous research, both internationally and within Australia. Kudnig et al (2020) showed a grain yield reduction of up to 45% and dry matter production down from 5.040 t/ha to 3.55 t/ha when comparing Hyola 970CL to retained F2 seed generations.
Method
15 Pacific Seeds Hyola® Innovation Systems Trials and five Pacific Seeds TD Hyola® Trait Tolerance Systems Trials were established for Spring type canola across Australia and five trials for Winter type canola, representing a diverse range of environments within the canola-growing regions in 2023. 18 sites for the Spring types and three for the Winter type canola were retained for harvest and data analysis, as two spring and two winter type sites were abandoned due to the trials having unacceptable agronomic integrity.
The remaining trial environments had a wide range of differences relating to seasonal rainfall, cropping histories, soil types and soil pH, with a combination of Best Management Practice (BMP) and District Standard Practice (DSP) treatments applied per each location aimed at maximising potential yields for the varieties present, thus enabling a diverse set of data collection for accurate comparison.
Spring-type Canola trials
The generation treatments for six Spring type hybrids were embedded within the unique Hyola Innovations Systems trial design. These trials are based upon RCB spatial designs (2 reps, 12 ranges), with each of the six varieties having F1, F1-F2 blend at 50:50 mix and F2 retained seed treatments.
Each variety treatment had the full registered label rate of appropriate herbicides applied at the optimum timing as per the inherent herbicide tolerance.
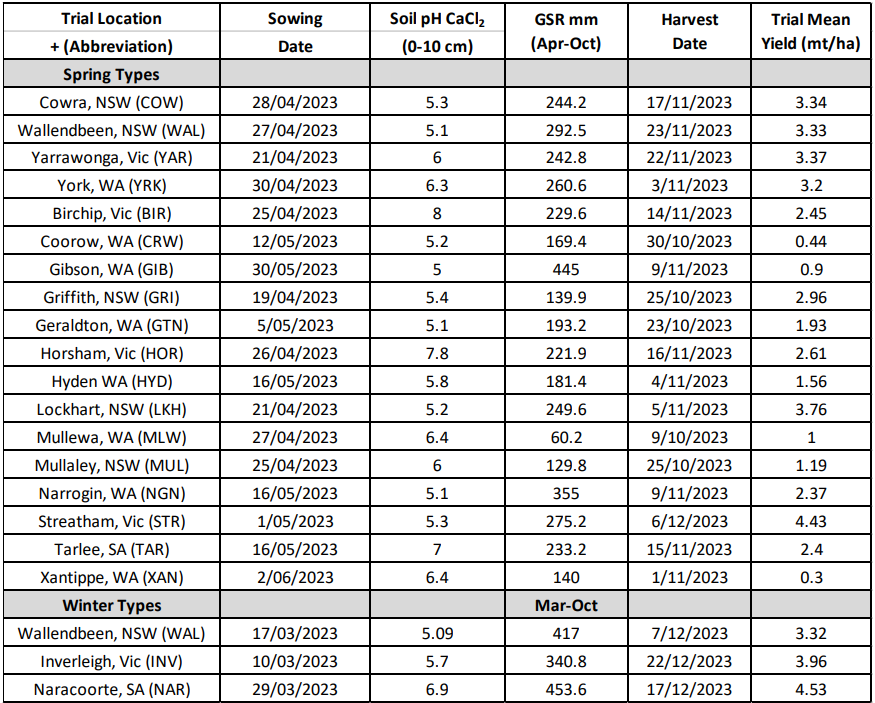
Table 1: 2023 trial locations, sowing dates, environmental conditions, and site mean yields.
The plant densities targeted at sowing for all treatments was 40 plants per square meter and adjusted by sowing a set number of seeds per plot. 500 seeds were sown per plot of 9 m2 using 90% germination and a 75% establishment factorial.
The F1 seed was commercial hybrid seed produced in 2022.
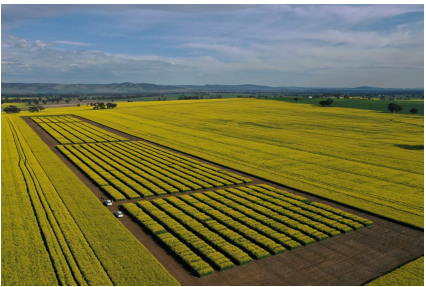
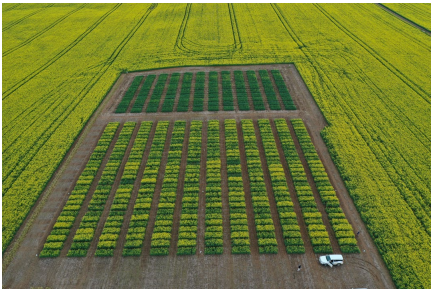
Image 1. 2023 Cowra NSW Hyola Innovation Trial site
Image 2. 2023 Wallendbeen NSW Hyola Innovation trial site
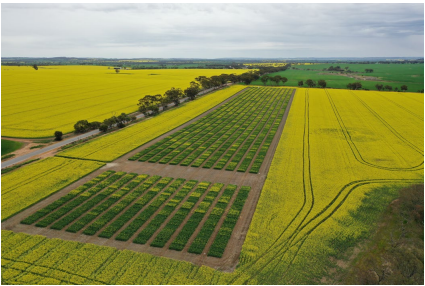
Image 3. 2023 York WA Hyola Innovation trial site
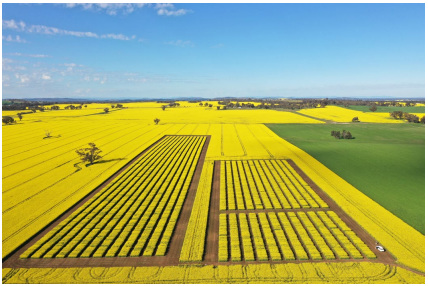
Image 4. 2023 Yarrawonga Vic Hyola Innovation trial site
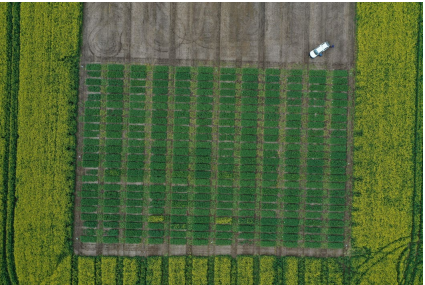
Image 5. 2023 Tarlee SA Hyola Innovation trial site
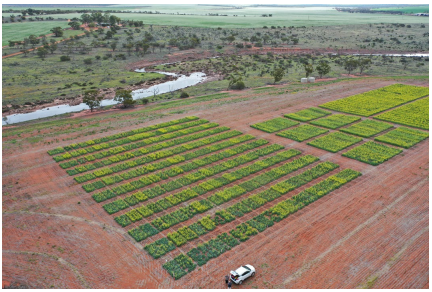
Image 6. 2023 Mullewa WA Hyola Innovation trial site
The F2 retained seed was graded to > 1.8 mm prior to packing the seed. The F1-F2 treatment was a homogenous 50:50 blend of seed of hybrid F1 and F2 retained generation seed. Plant establishment counts at each location were conducted at the 3-5 leaf stage (BBCH 13-16) by counting 3*1m or 4*1m rows per plot to establish plants per meter square.
Grain yields were measured on each treatment by small plot harvesters. Grain oil percentage content is yet to be analysed and is not available for this paper, so it was not included in gross margin calculations.
A “simplified” Gross Margin (SGM) was calculated as, SGM = Grain yield * grain price – estimated seed cost. These values were used in this research as each environment will have differing input costs relative to the expected grain yield, but within each environment, the input costs for fertiliser, herbicides, etc. are assumed to be equal, irrespective of the seed generation sown. Assumptions for the value of seed and harvested grain pricing are shown in Tables 2 a-c.
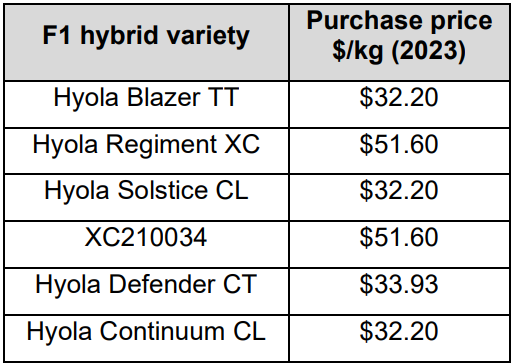
Table 2a: Assumptions used for SGM calculations for
Spring canola treatments Hyola hybrid seed costs.
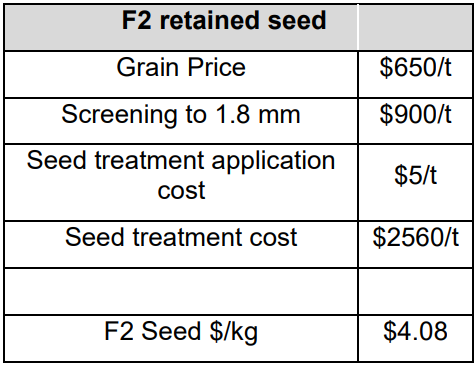
Table 2b: Assumptions used for SGM calculations for
Spring canola treatments F2 retained seed.
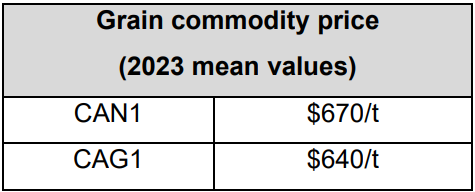
Table 2c: Assumptions used for SGM calculations for Spring canola commodity with prices averaged between Geelong and
Kwinana Ports for 12 months Jan – Dec 2023 Australia
The SGM for Winter canola grazing values have been calculated using the assumption in Table 3 below using the following formula.
Grazing value ($/ha) = Dry matter produced (kg/ha)*grazing yield (%)/DM consumption per day(kg/hd/day)*meat yield per(kg/day)*meat value ($/kg).
Grain value ($/ha) = (Grain yield (t/ha)*grain value ($/t)) - seed cost/ha ($/ha)
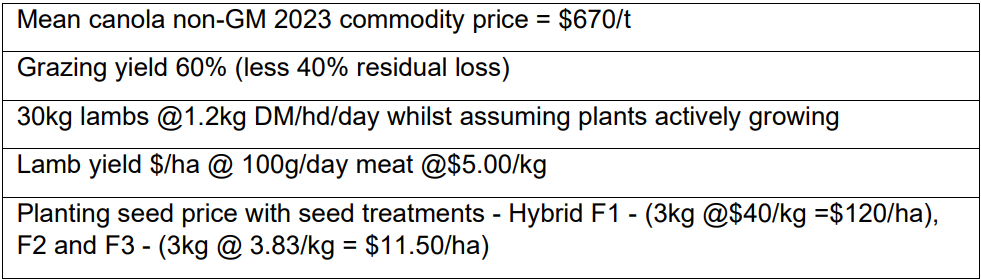
Table 3: Assumptions for SGM calculation on Winter canola generation comparisons.
Generation and yield analysis for single sites were performed fitting variety, generation, dry matter (Winter Only) as fixed linear factors and spatial adjustments performed using the auto-regressive model hence giving a BLUE output for each site. Statistical reference: Using ASReml (Butler et al., 2023).
In addition, yield, dry matter (Winter Only) and generation were further investigated using single step factor analytic Multiple Environment Trial (MET) analysis with ASReml in a model with generation as a linear fixed factor with composite variety as 5 a random factor hence giving a BLUP for each site. Spatial adjustments were determined using the auto-regressive model. Significant G*E*M effects were identified by the MET analysis. Statistical reference: Using ASReml (Gilmour et al., 2010).
Results and discussion
Spring canola plant establishment
Concerning plant establishment, French et al. (2016) showed that canola field establishment varied from 0.3 to 1 and was higher at low target density with a median of 0.585 at a target density of 40 plant/m2. This research achieved a mean establishment of 0.65 for the target population density of 40 plants/m2 across all treatments. The Spring trials experienced a range of establishment conditions but showed only a relatively narrow range between 58-74% of the target population in contrast to previously reported research.
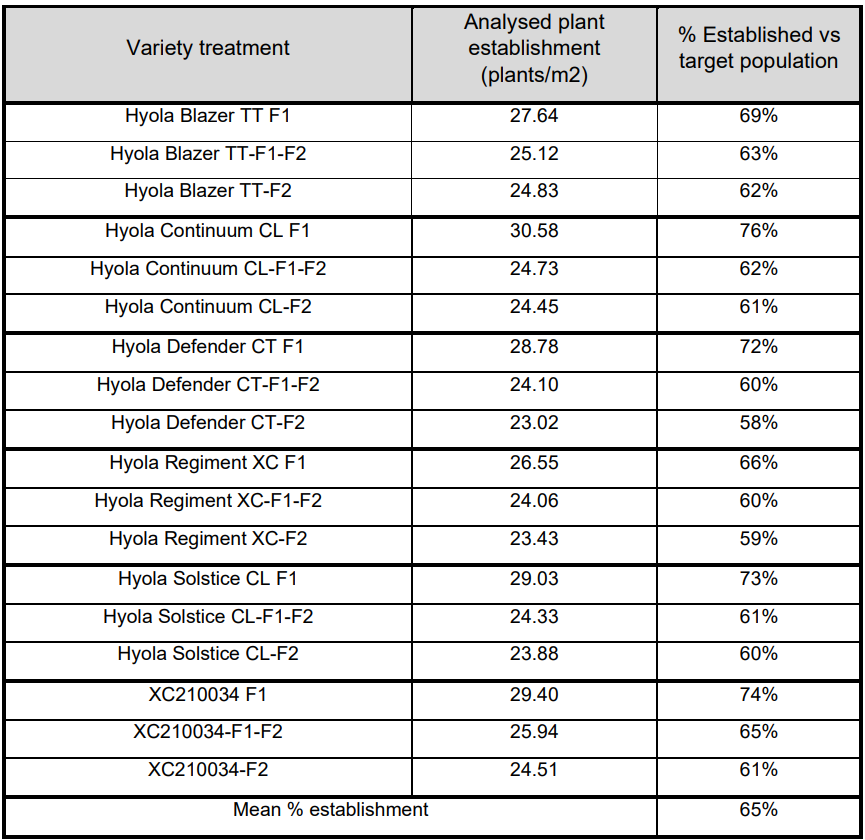
Table 4: Analysed plant density achieved across treatments.
Graph 1: Analysed established plant density by variety by generation (Mean + SE, p<0.05).
Established plant density for the F1 hybrid treatments are significantly greater (p<0.05) for each variety compared to the F1- F2 and F2 treatments. There were no differences between varieties within F1-F2 blended seed treatment or the F2 seed treatment. Graph 1 shows the decline in plant establishment, which implies that a higher seeding rate would be required when sowing F2 seed to establish the equivalent plant density as that of the F1 hybrid. This leads to increasing costs associated with the F2 treatments to potentially achieve the agronomic benefits of additional weed competition and associated harvest management.
The lower established plant densities achieved in the F2 treatments could be attributed to a number of factors such as lower seedling vigour, segregation of plant types, and disease resistance. The F2 progeny has segregated out to a less vigorous and more variable plant leading to lower overall yields (Nuseed Techsheet 2022).
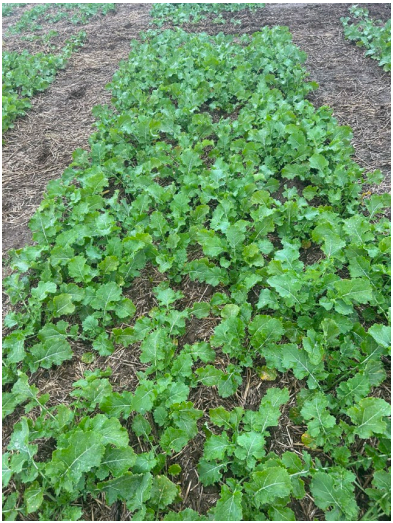
Image 7. 2023 Cowra NSW Trial
Hyola Blazer TT – F1 Hybrid
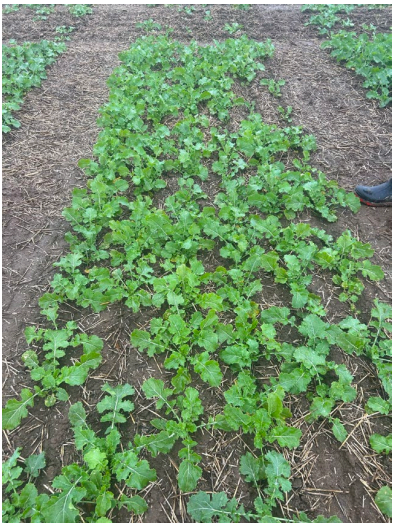
Image 8. 2023 Cowra NSW Trial
Hyola Blazer TT – F1/F2 50:50 blend
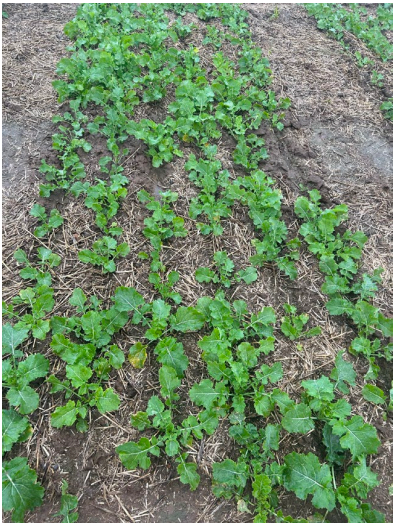
Image 9. 2023 Cowra NSW Trial
Hyola Blazer TT – F2 retained.
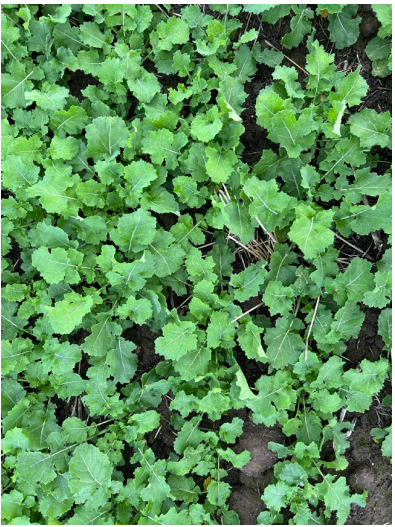
Image 10. 2023 Horsham Vic Trial
Hyola Defender CT – F1 Hybrid
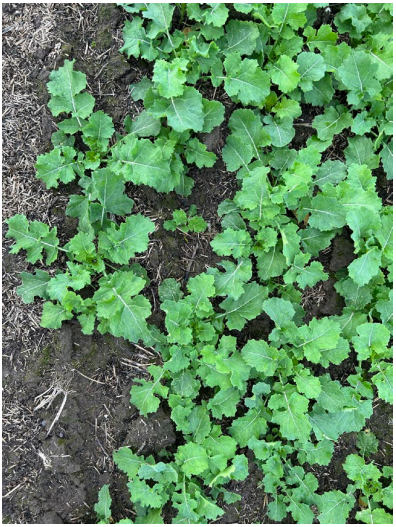
Image 11. 2023 Horsham Vic Trial
Hyola Defender CT – F1/F2 50:50 blend
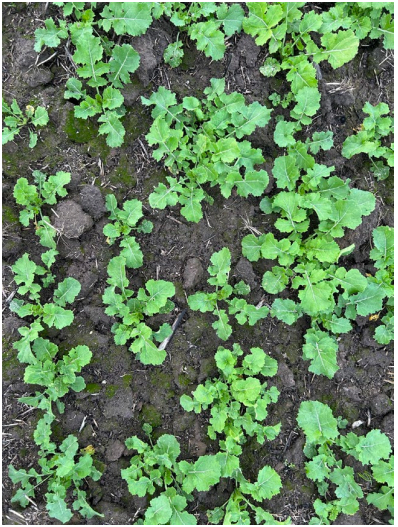
Image 12. 2023 Horsham Vic Trial
Hyola Defender CT – F2 retained.
The F1 hybrid demonstrating heterosis or hybrid vigour for all plants in all plots, with the F1:F2 blend sowing a mix of F1 hybrids and F2 plants segregating for early vigour and the F2 generation showed a significant variation in plant establishment, plant types, and much lower ‘OP like” growth patterns.
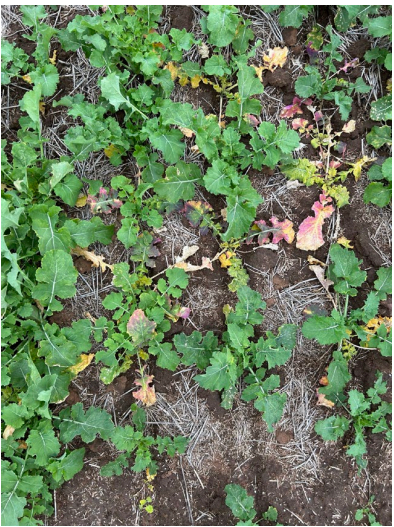
Image 13. 2023 Birchip Vic Trial
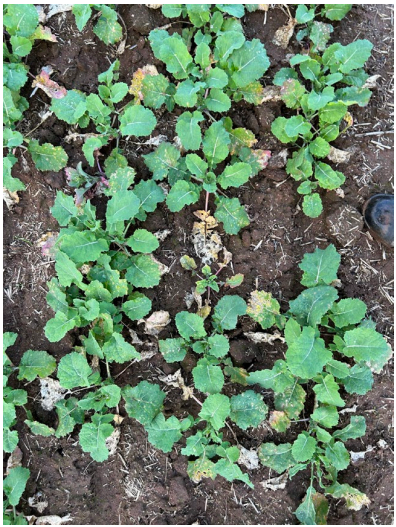
Image 14. 2023 Yarrawonga Vic Trial
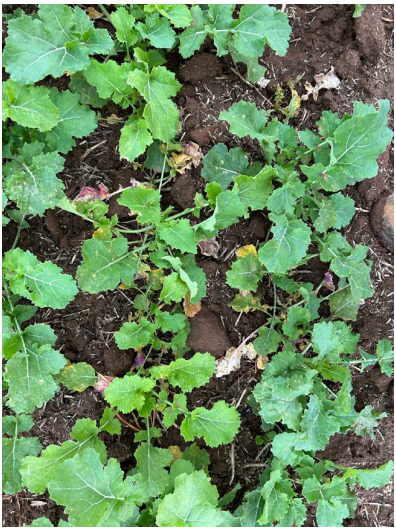
Image 15. 2023 Horsham Vic Trial
Hyola Regiment XC – F2 generation retained plants segregating for glyphosate tolerance with approximately 25% loss observed of susceptible plants across all trial environments in Australia.
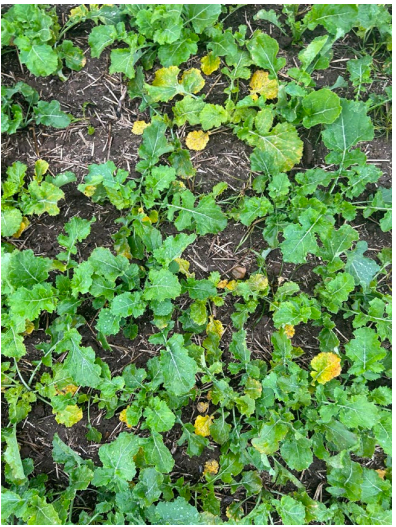
Image 16. 2023 Yarrawonga Vic Trial
Hyola Defender CT - F2 retained
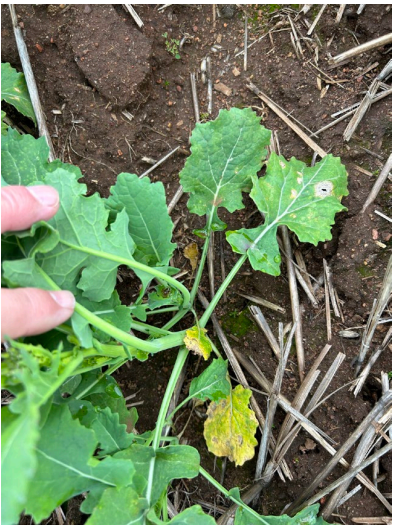
Image 17. 2023 Narrogin WA Trial
Hyola Blazer TT – F2 retained
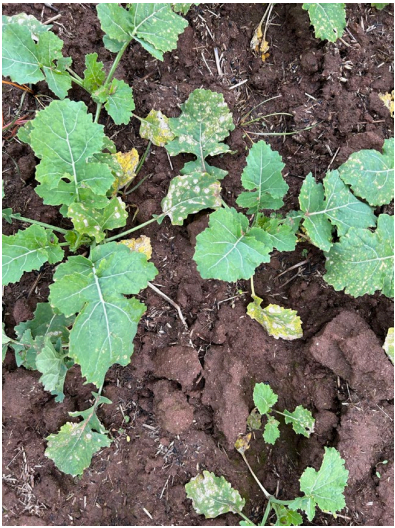
Image 18. 2023 Lockhart NSW Trial
Hyola Continuum CL – F2 retained.
The F2 generations showed that the plants are segregating for major gene blackleg disease resistance and some plants within the populations of all the 6 varieties at most sites were exhibiting observed higher levels of leaf infection than the original F1 hybrids.
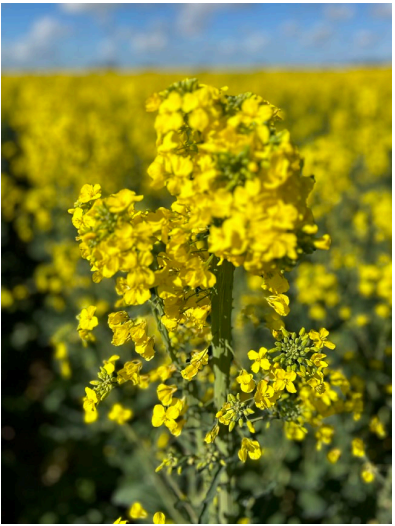
Image 19. 2023 Geraldton WA Trial
Hyola Regiment XC - F2 retained
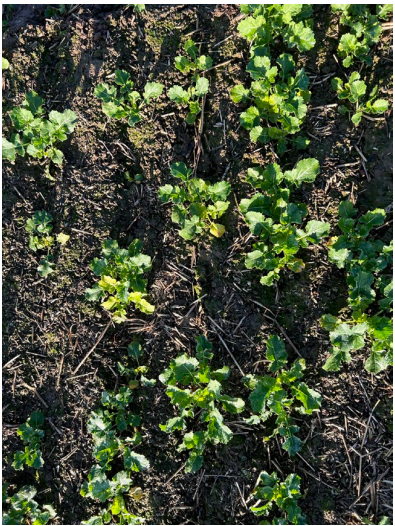
Image 20. 2023 Tarlee SA Trial
Hyola Blazer TT – F2 retained
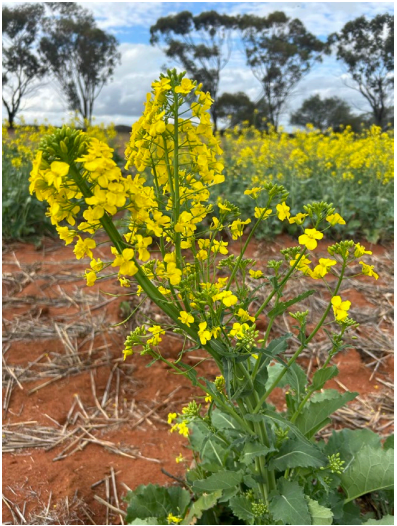
Image 21. 2023 Mullewa WA Trial
Hyola Solstice CL – F2 retained.
The F2 generations showed that the plants are segregating for many agronomic traits to different degrees and some plants within the populations of all the 6 varieties were exhibiting observed higher levels fasciation and deformed plant types.
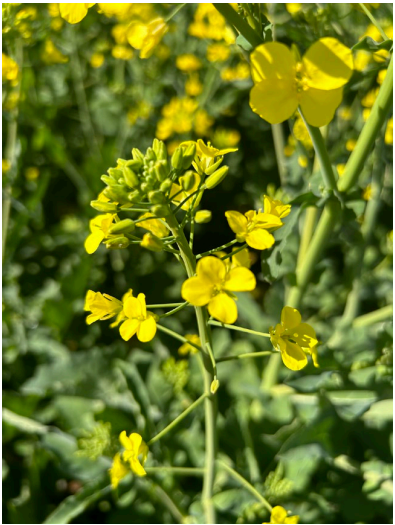
Image 22. 2023 Birchip Vic Trial
Hyola Continuum CL - F2 retained
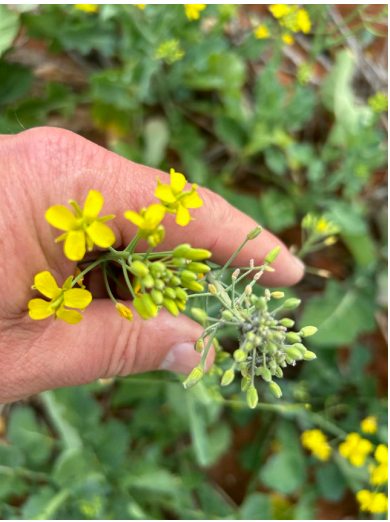
Image 23. 2023 Mullewa WA Trial
Hyola Blazer TT – F2 retained
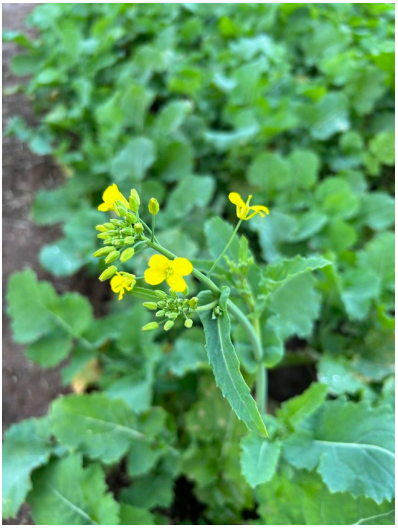
Image 24. 2023 Yarrawonga Vic Trial
Hyola Defender CT – F2 retained.
The F2 generations showed that the plants are segregating for sterility within the populations of all the 6 varieties and were exhibiting approximately 25% of all plants being sterile across all trial environments in Australia.
Spring canola grain yield
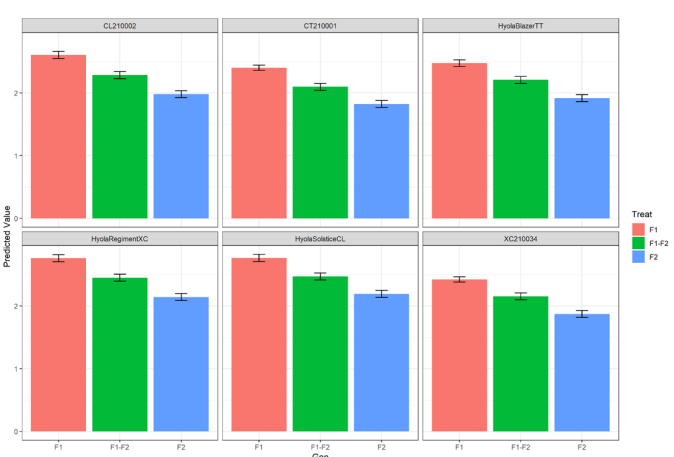
Graph 2: Analysed MET grain yields by generation
showing significantly declining yield (p<0.001) from the F1
hybrid treatment to the F1-F2 and F2 treatments for all six
varieties.
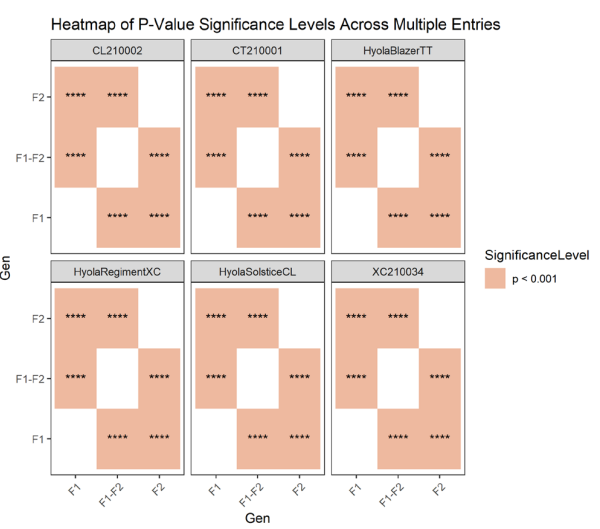
Figure 1: Yield heatmap of P-Value (p<0.001) significance
level across generation and v
Sowing F2 seed significantly decreased yield as either the F1-F2 blend or F2 treatment performed better across all environments, as shown in Graph 2 using ASReml MET analysis. The overall analysed yield decline across all hybrids and environments from F1 to F1-F2 is 295 kg/ha, and from F1 to F2 is 585 kg/ha.
Figure 1 illustrates the yield heat map of significance levels between all the treatments, where the F1 hybrid treatment provided significantly higher yields than the F1:F2 blend and F2 treatments. The F1:F2 blend was also significantly higher yielding than the F2 treatment across all environments and varieties.
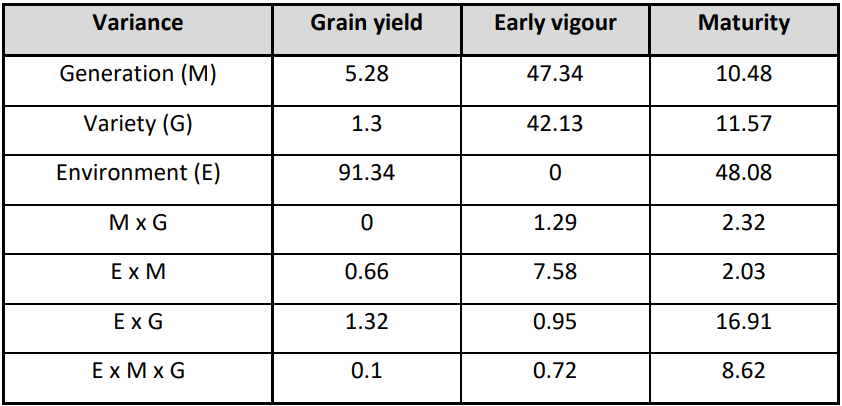
Table 5: MET table of variance.
MET analysis table of variance shows just over 91% of the variation in grain yield responses can be attributed to the environmental effect, and only 5% can be attributed to the generation when compared across a wide range of environments. Environmental (E) conditions often override and strongly influence the yield potential equation when comparing environments with widely different yield potentials. This contrasts with maturity and early vigour scores which were also assessed, where (E) is attributed to much lower % variances. Variety (G) and generation (M) have proportionally more variance attributed to them across environments indicating the degree of influence these treatments have on early vigour and maturity.
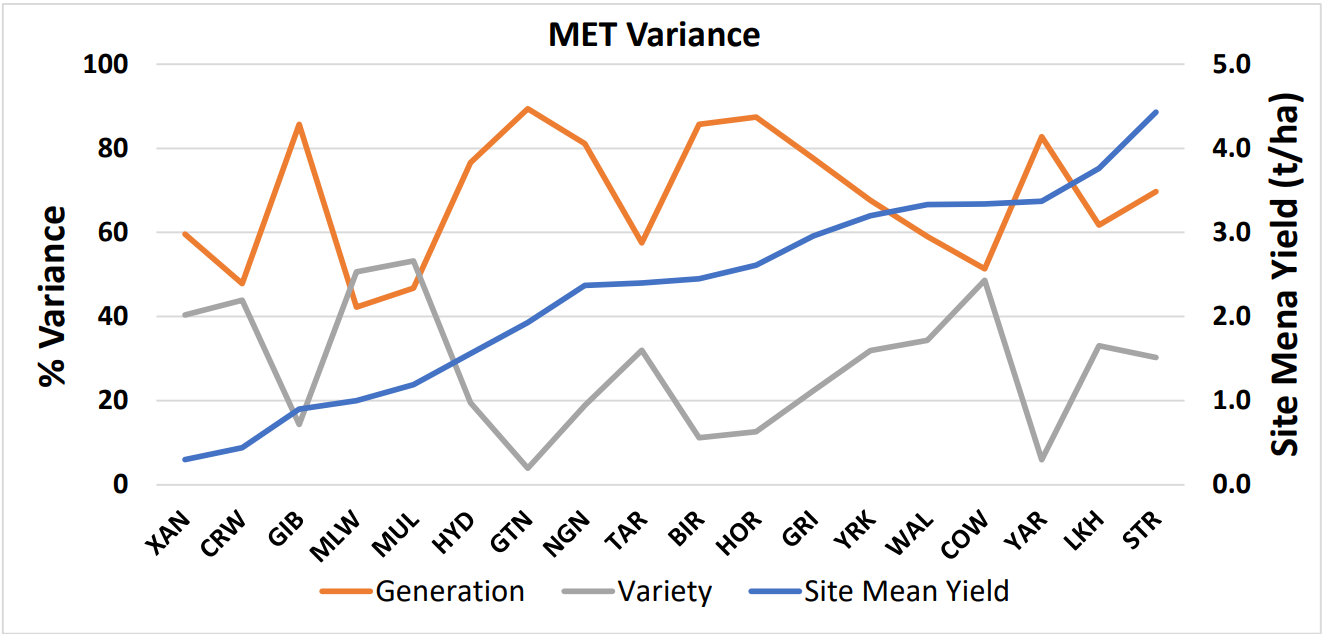
Graph 3: MET variance attributed to generation and variety at single sites for grain yield.
The MET single-site analysis output shows generation (M) and variety (G) have the greatest influences on variation in grain yield. Graph 3 plots the variance attributed to both generation and variety at single sites. The median value of generation variance is 68.68%, and variety is 31.1% across the 18 sites. This shows that generation is the driving factor (influence) on yield decline from F1 to the F1-F2 and F2 generation treatments.
There are only 2 sites, MLW and MUL, where the attributed variance of variety is slightly greater than generation. Both these sites were droughted sites with very limited April-October rainfall.
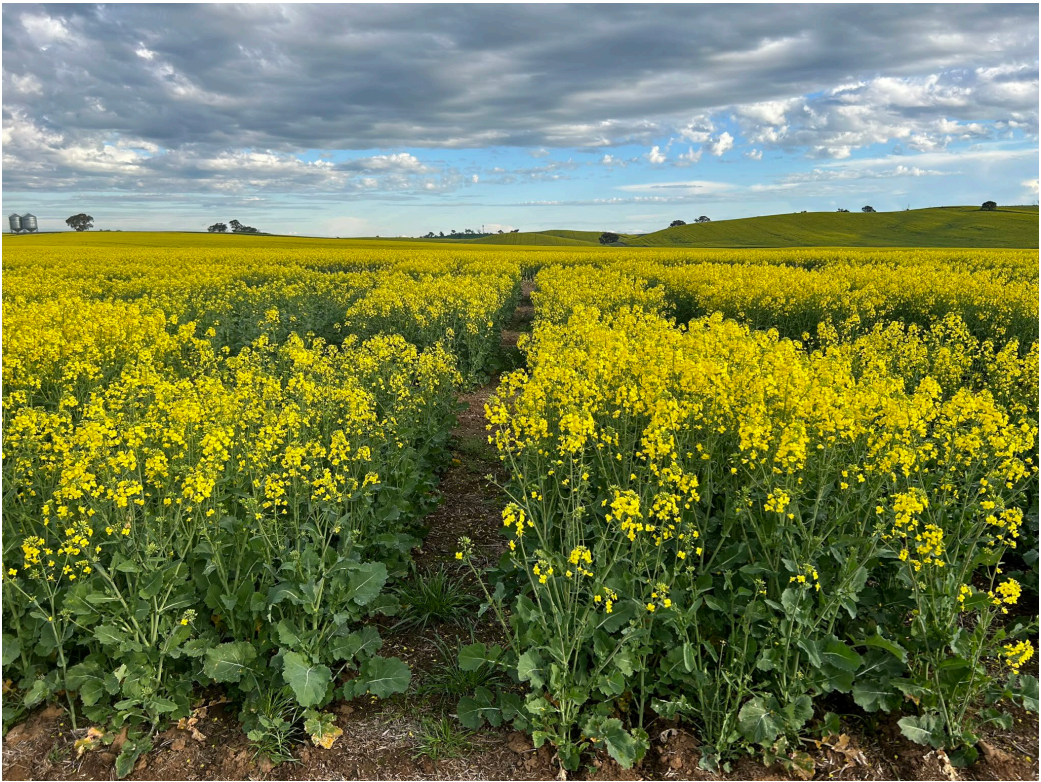
Image 25. 2023 Wallendbeen NSW Trial – Hyola Continuum CL F2 generation (LHS) vs F1 Hybrid (RHS)
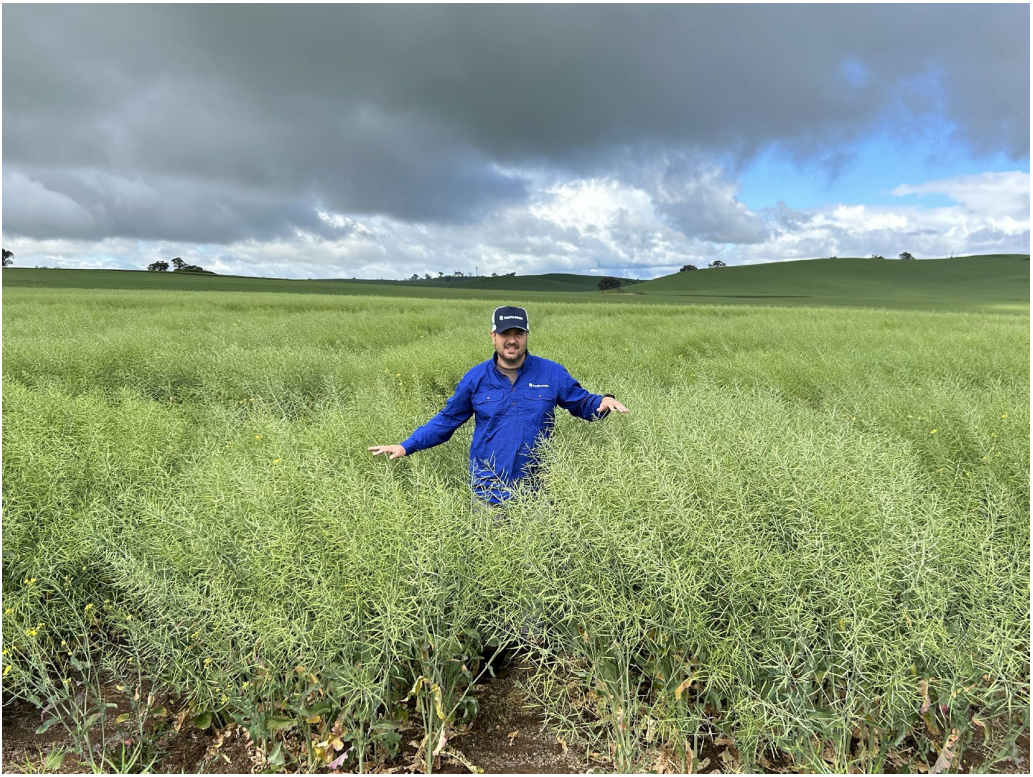
Image 26. 2023 Wallendbeen NSW Trial – Hyola Defender CT F2 generation (LHS) vs F1 Hybrid (RHS)
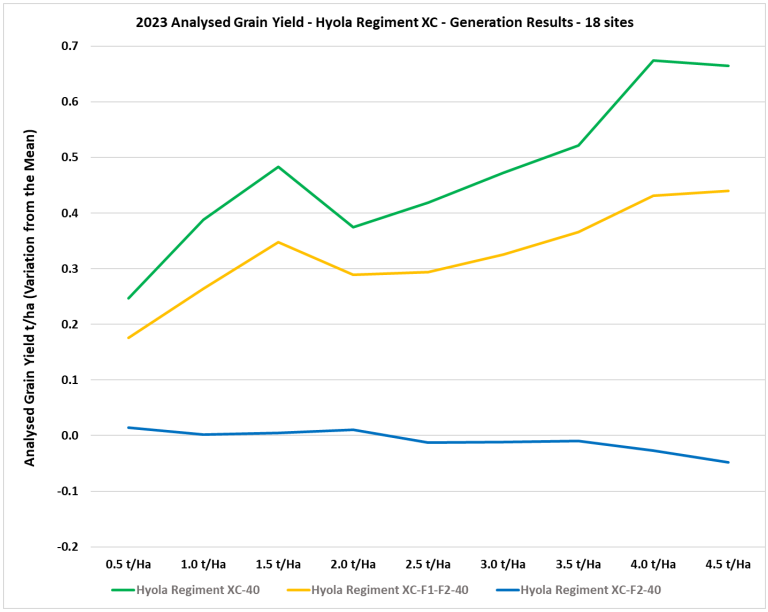
Figure 1. 2023 Hyola Regiment XC MET generation treatments analysis across 0.5 t/ha trial mean yield increments.
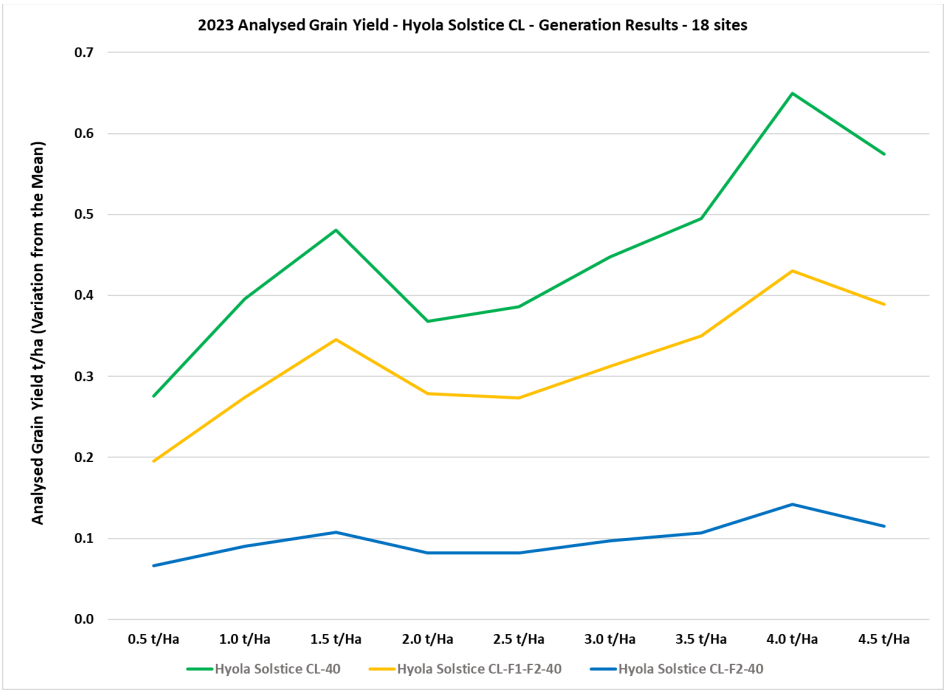
Figure 2. 2023 Hyola Solstice CL MET generation treatments analysis across 0.5 t/ha trial mean yield increments.
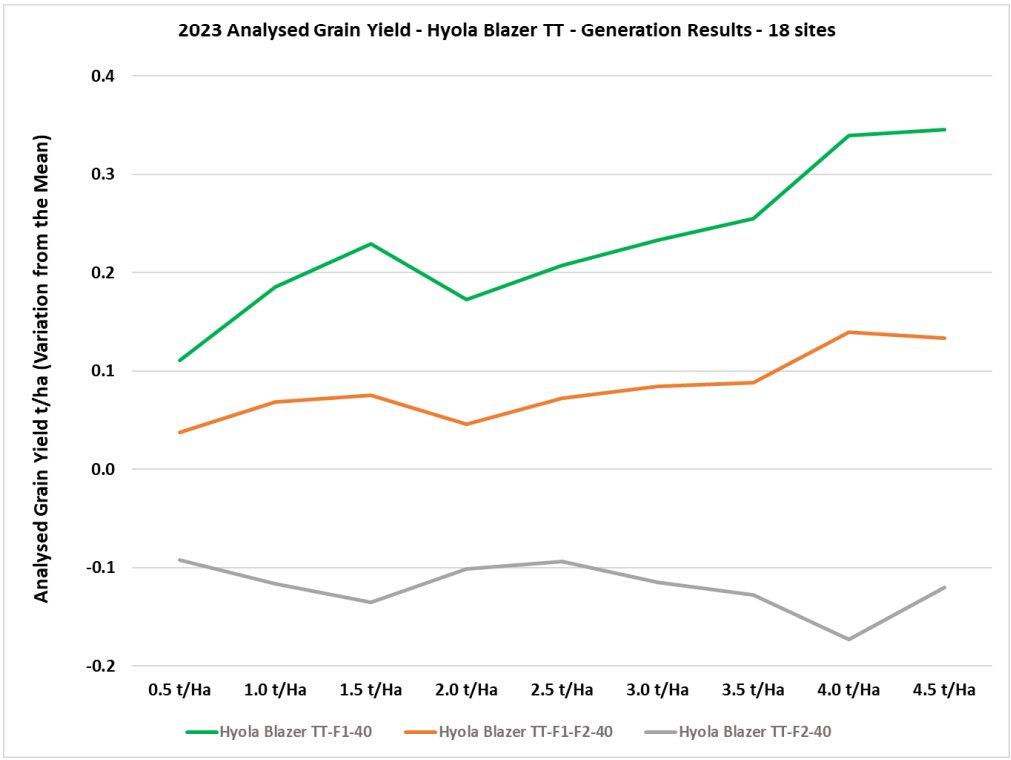
Figure 3. 2023 Hyola Blazer TT MET generation treatments analysis across 0.5 t/ha trial mean yield increments.
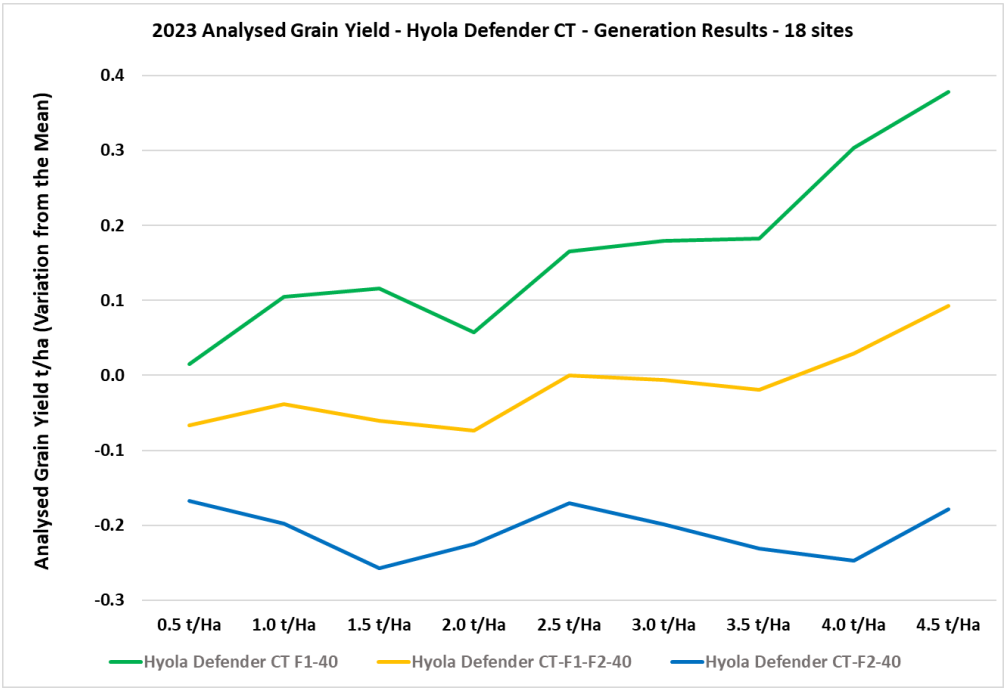
Figure 4. 2023 Hyola Defender CT MET generation treatments analysis across 0.5 t/ha trial mean yield increments.
Spring canola simplified gross margins
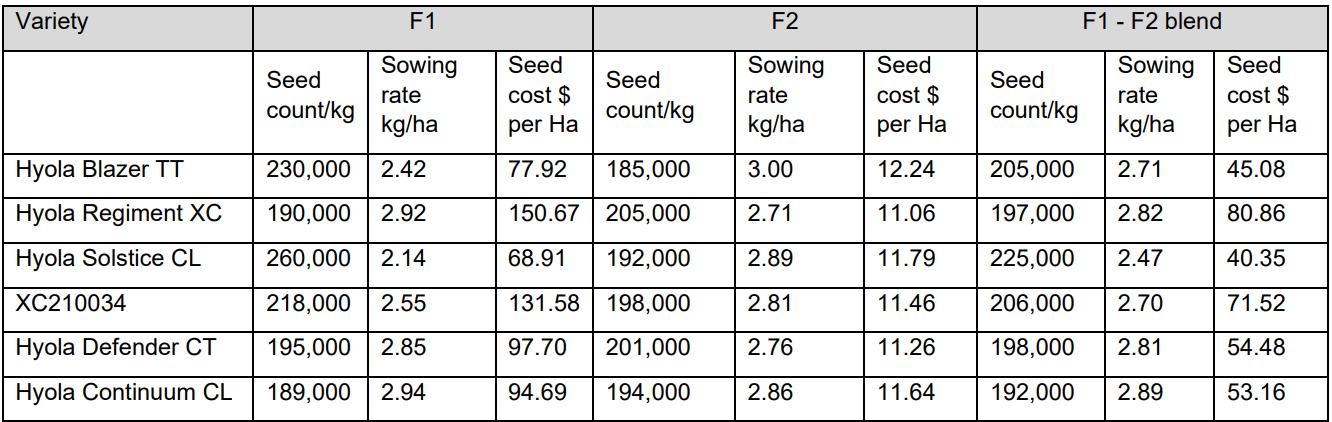
Table 6: Seed size, sowing rate, and seed cost $/ha for Spring canola generation treatments.
Table 6 shows the distribution of seed cost per hectare based on seed count, sowing rate required to achieve the calculated target plant density of 40 plants/m2 and the value of seed. These values were determined from Tables 2 a-c.
The six hybrids represent a range of herbicide tolerances available to growers, from single to stacked herbicide technologies. As the F1 treatment yields were significantly higher than the other treatments, the SGM are also higher, returning to the grower the highest value.
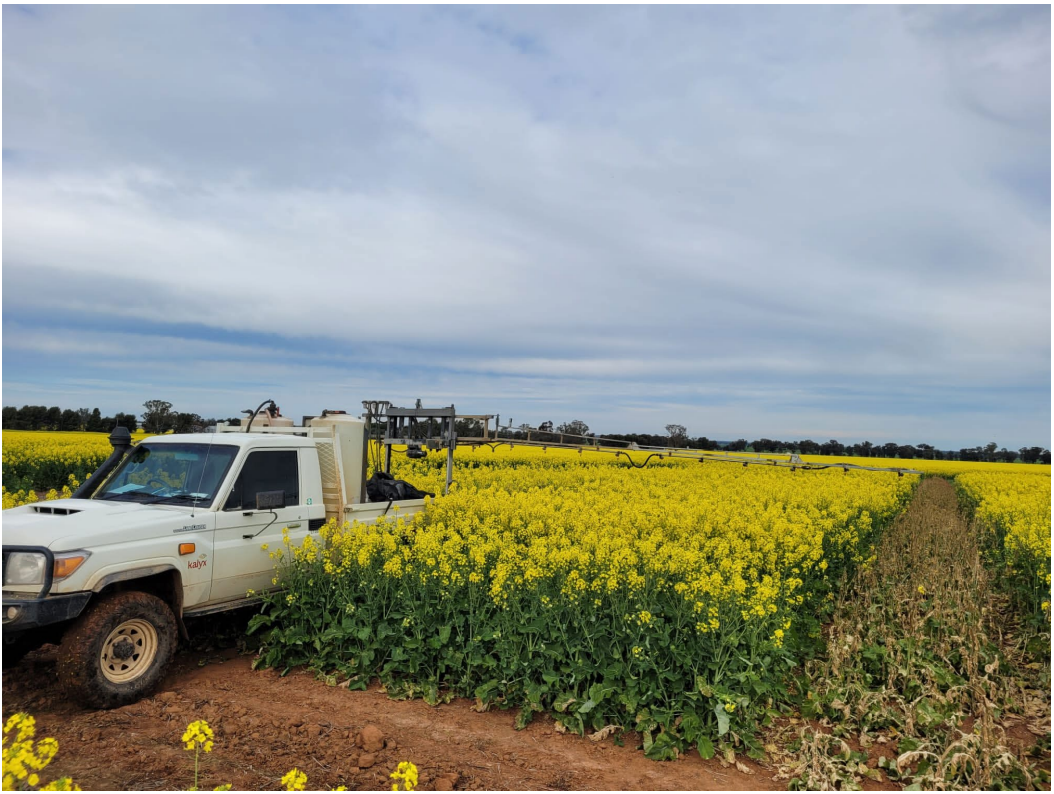
Image 27. 2023 Lockhart NSW Trial – All sites professionally managed by Independent 3rd party Trial Service Providers.
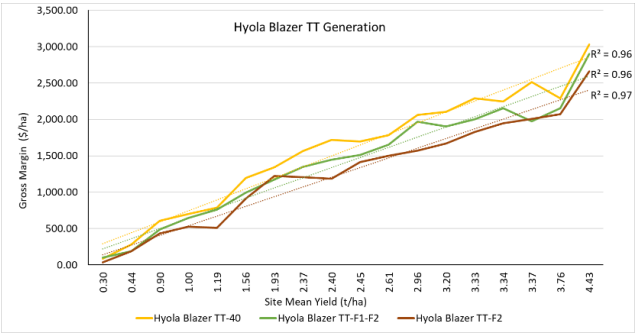
Graph 4a: Hyola Blazer TT simplified gross margin
regression for generation treatment across 18 sites.
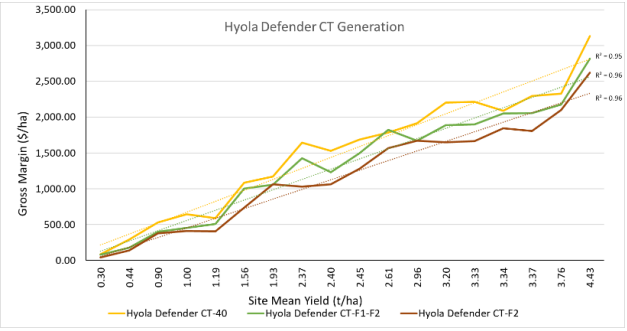
Graph 4b: Hyola Defender CT simplified gross margin
regression for generation treatment across 18 sites.
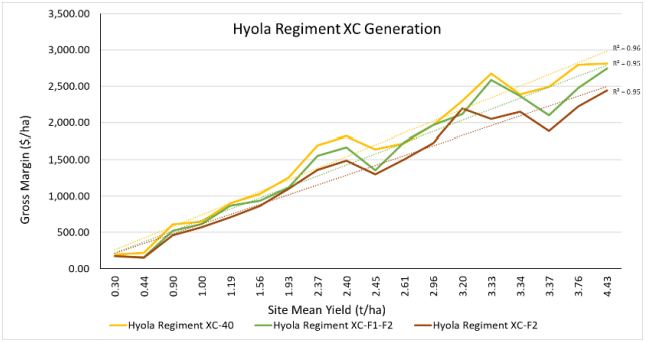
Graph 4c: Hyola Regiment XC simplified gross margin
regression for generation treatments across 18 sites.
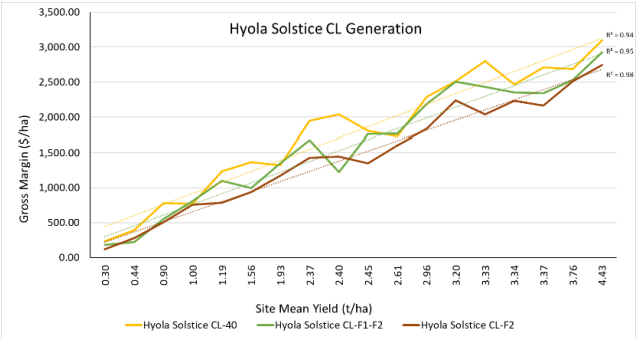
Graph 4d: Hyola Solstice CL simplified gross margin
regression for generation treatment across 18 sites.
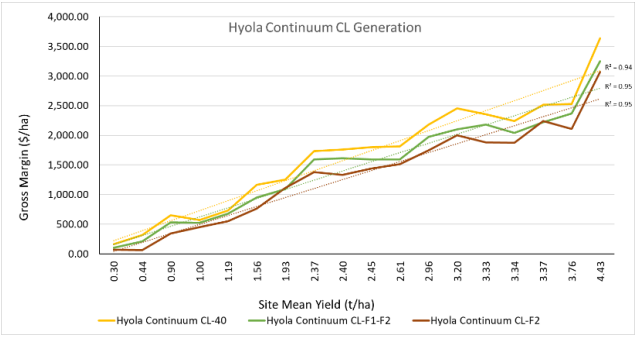
Graph 4e: Hyola Continuum CL simplified gross margin
regression for generation treatment across 18 sites
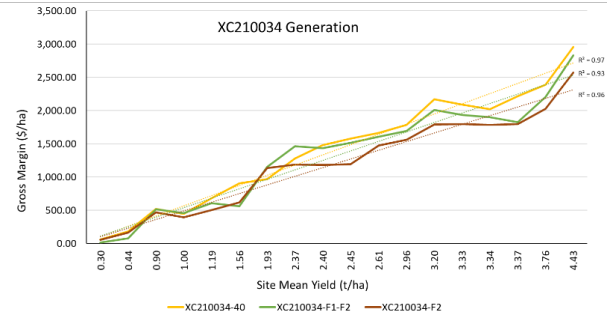
Graph 4f: XC210034 simplified gross margin regression
for generation treatment across 18 sites
The SGM outcomes reflect the yield differences across environments and generation treatments. The SGM for F1 is greater than F1-F2 which is greater than F2 for the majority of hybrids and sites, Graphs 4 a-f show the SGM plotted against site mean yield for the 18 sites. As the site mean yield increases, so does the gross margin value of the F1 seed compared to the other treatments. At low potential yield sites (less than 0.9t/ha), the difference between the SGM is much smaller in margin value. Linear regressions have been fitted to each set of data.
The GM canola (those varieties incorporating the TruFlex trait) SGM shows the F1-F2 being equivalent or slightly below the F2 treatment at very low yielding sites, and the difference to the F1 treatment is minimal. Most importantly, the value of the F1 seed remains greater than the F1-F2 and F2 seed, irrespective of the yield potential of the site.
A further consideration is the overall actual profitability of growing canola in low potential yield sites. For such low yielding environments, if all production costs were considered, canola may not be a profitable option for some growers, irrespective of the seed source that they choose to use. Even in these tougher growing environments, using a seed source such as an F1:F2 blend or a F2 generation effectively does improve profitability relative to Hybrid F1.
Winter canola dry matter and grain yield
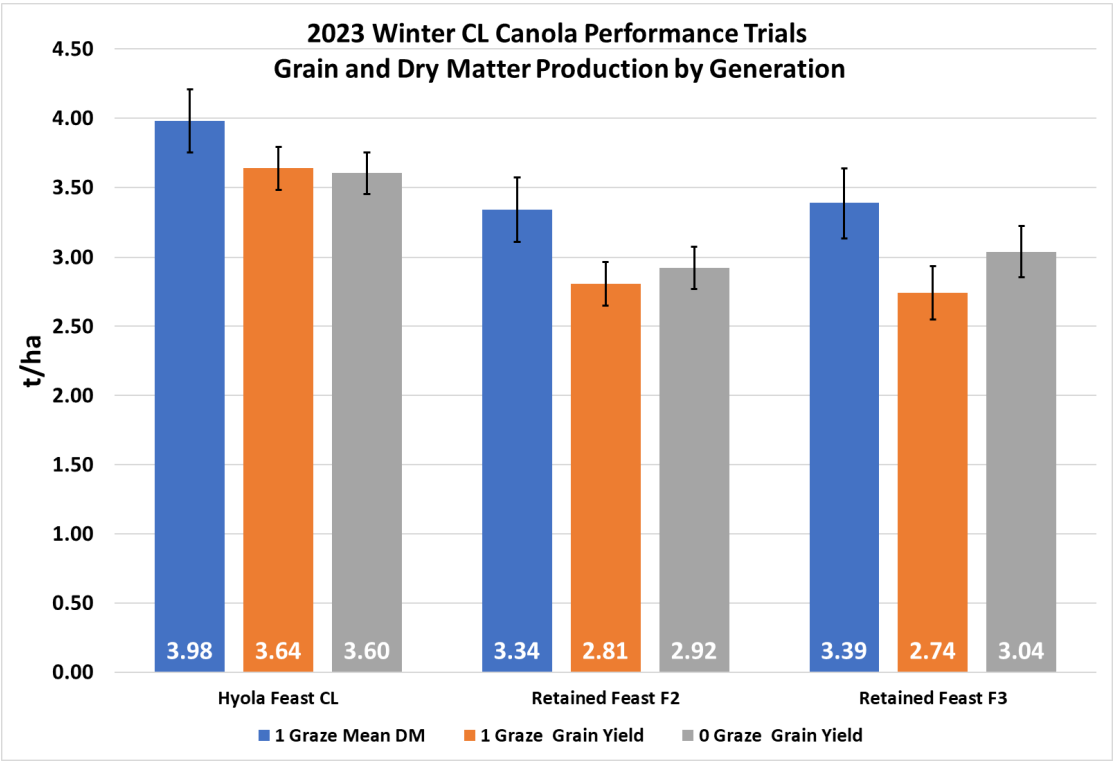
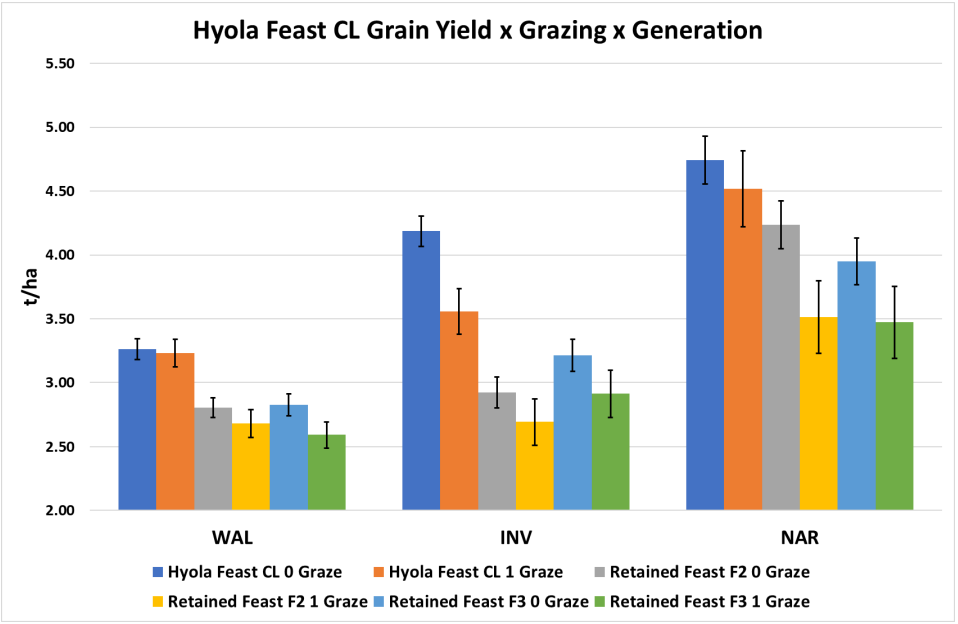
Graph 5: 2023 Dry matter and grain yield production across treatments (Mean + SE, p<0.05).
Graph 5 demonstrates that over all environments, the F1 Hyola Feast CL treatment produced the greatest grain yields and dry matter when compared to the F2 and F3 treatments, irrespective of grazing treatment. Grain yield and dry matter of the F2 and F3 generations were not significantly different across environments and grazing treatment.
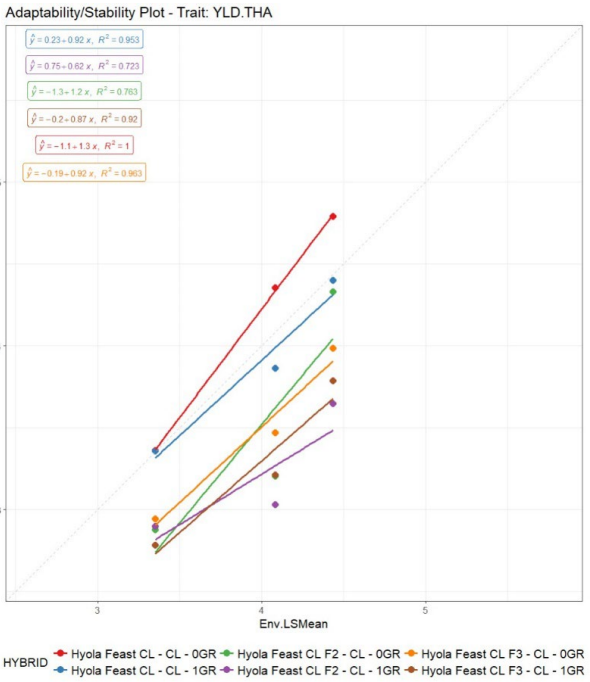
Graph 6: Yield stability plot of 3 generations of Hyola Feast CL
The grain yield stability varies across the three generations evaluated in 2023. F1 hybrid grain yield is decreased by grazing pressure at higher-yielding sites represented in Graph 6. F2 retained seed grain yields incur greater decreases from grazing than the F1 hybrid, whilst the F3 retained generation shows a more stable response (decreased) to grazing over the yield range of these sites.
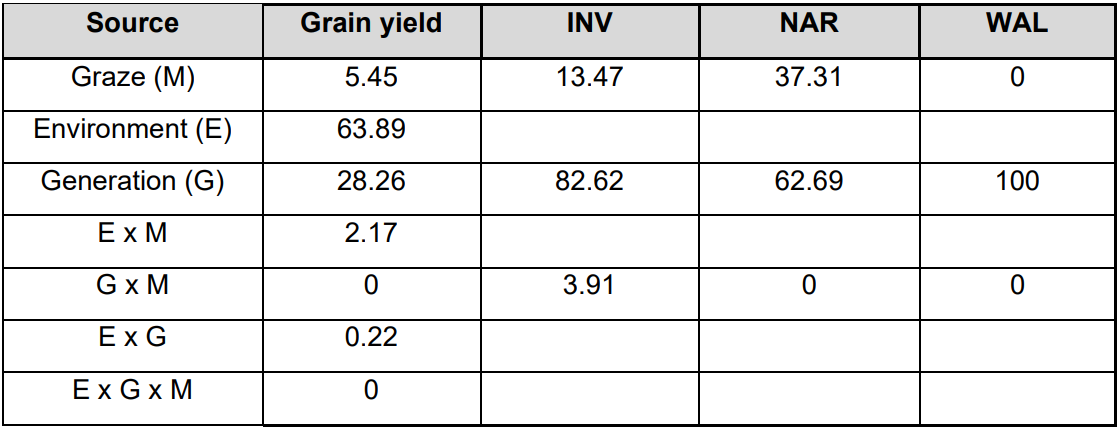
Table 7: Grain yield MET table of variance being attributed to grazing (M), generation (G) and environment (E).
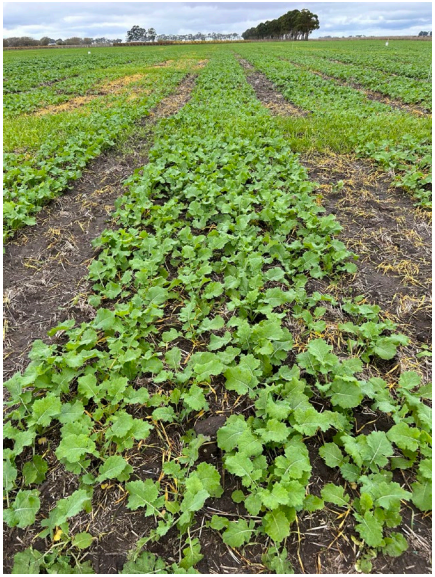
Image 28. 2023 Naracoorte SA Trial
Hyola Feast CL – F1 Hybrid
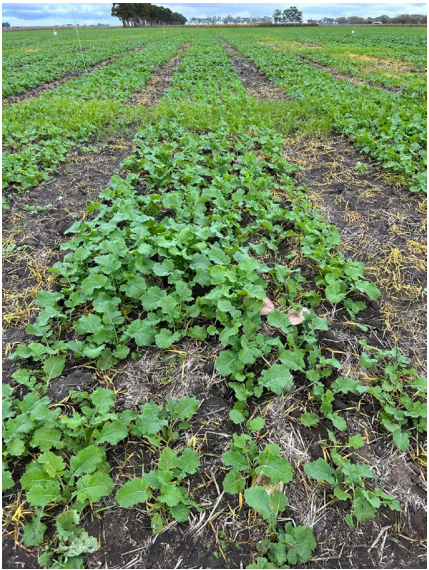
Image 29. 2023 Naracoorte SA Trial
Hyola Feast CL – F2 generation
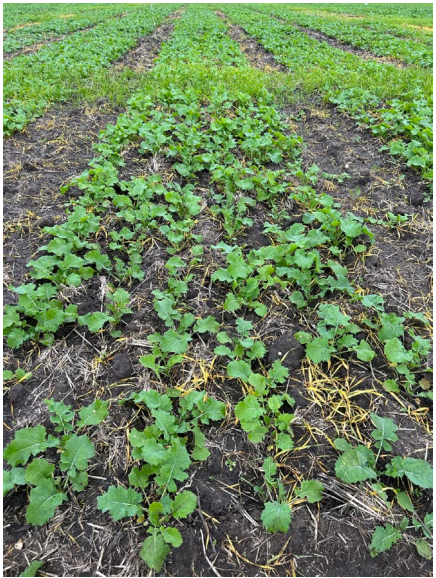
Image 30. 2023 Naracoorte SA Trial
Hyola Feast CL – F3 generation
The generational shift from F1 hybrid to F2 generation to F3 generations clearly shown above with less growth and biomass associated with the F2 & F3 segregating generational populations along with displaying reduced plant establishment.
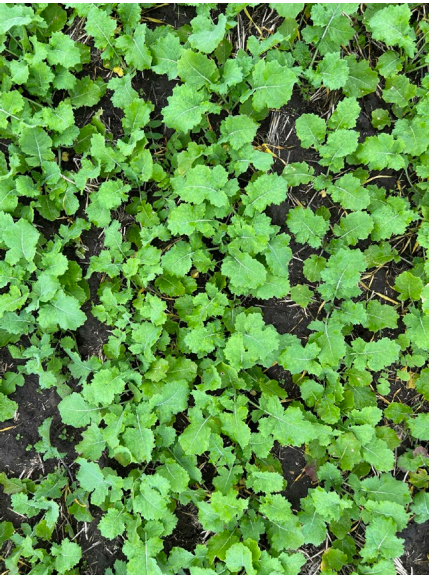
Image 31. 2023 Naracoorte SA Trial
Hyola Feast CL – F1 Hybrid
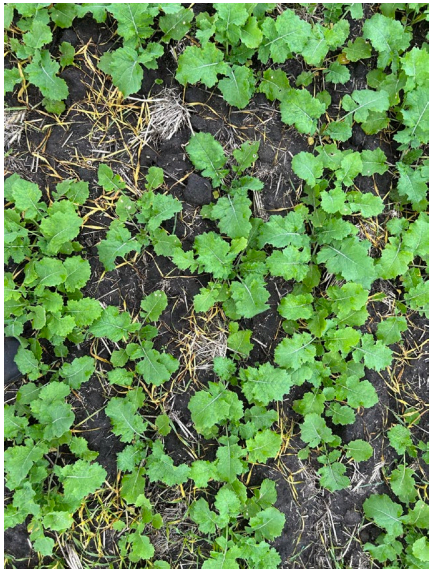
Image 32. 2023 Naracoorte SA Trial
Hyola Feast CL – F2 generation
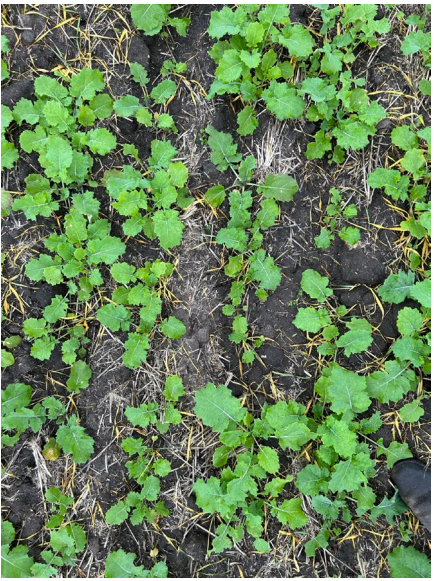
Image 33. 2023 Naracoorte SA Trial
Hyola Feast CL – F3 generation
The generational shift from F1 hybrid to F2 generation to F3 generations clearly shown above with less growth and biomass associated with the F2 & F3 segregating generational populations along with displaying reduced plant establishment.
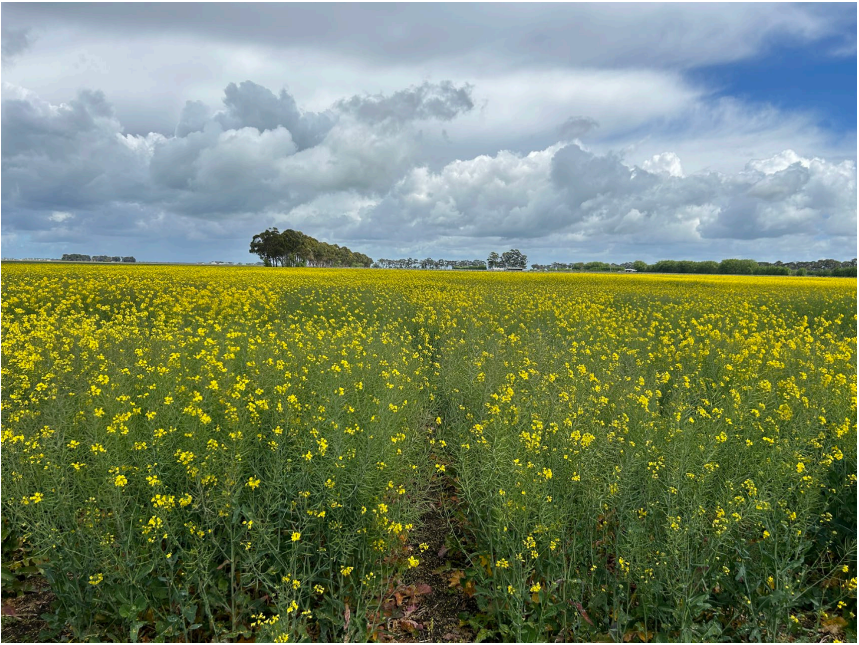
Image 34. 2023 Naracoorte SA Trial – Hyola Feast CL – F1 Hybrid (LHS) vs F2 generation (RHS)
Image 35. 2023 Naracoorte SA Trial – Hyola Feast CL – F1 Hybrid (LHS) vs F3 generation (RHS)
The F2 generations showed that the plants are segregating for sterility within the populations of all the 6 varieties and were exhibiting approximately 25% of all plants being sterile across all trial environments in Australia.
Environment (E) has attributed 64% of the variance in grain yield across sites, as shown in Table 7, and generation (G) has attributed 28%. Thus, (E) is the overriding factor in grain yield across all environments.
At individual sites, generation (M) has attributed to 63-100 % of the grain yield variance, showing that generation has the greatest influence on decreasing grain yield. Grazing management has less influence on grain yield, with results ranging between 0 – 37% dependent on individual environments. Using F1 hybrid seed provided the highest grain yield within any environment.
Graph 7: Analysed grain yield by generation, site, and grazing treatments (Mean + SE, p<0.05)
Grain yield for non-grazed treatments was significantly decreased by sowing retained F2 or F3 seed generation treatments compared to the F1 hybrid seed as shown in graph 7. Within the grazing treatments, sowing retained F2 or F3 seed significantly decreased grain yield at all locations.
Winter canola gross margin
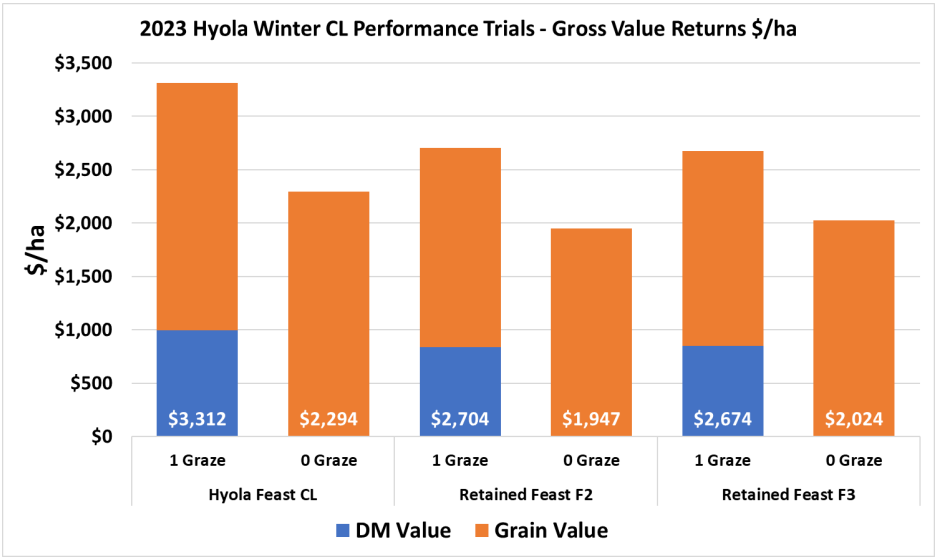
Graph 8: Gross Return in $/ha for grain only (0 graze) and combined grazing and grain (1 graze) across 3
generations and 3 sites in 2023.
Given the significant dry matter and grain yield differences between generations, as shown in graph 8, the combination of Graze and Grain for the hybrid F1 maximises returns ($3,312/ha), compared to any combination of treatments with retained seed ($2,704 and $2,674 /ha respectively). The combination of Graze and Grain maximises returns, irrespective of the generation of seed sown as the difference in grain yields within generation treatments is not significant. The value of the “Graze” option bolsters the $/ha returned.
Conclusion:
Retaining seed from hybrid canola into future generations decreases grain yield (Spring and Winter Types) and dry matter production (Winter types). This significant reduction in grain yield production, reduces gross returns to growers and their associated profitability.
However, Spring type canola at very low yielding sites does show the delta between SGM’s become less apparent. Therefore, this research has shown that retaining canola seed into subsequent generations to save costs is false economics and other management options should be considered or explored.
Grazing Winter type canola maximises grower returns compared to grain only management. The value of the grazing component of the gross margin substantially improves the overall profitability of Winter canola where the grain yields have shown not to compromised by a single grazing event. Retaining Winter F2 or F3 generation seed for sowing contributes to being the largest impediment to profitability. Potential savings by reducing upfront seed costs has been proven to be not sufficient to cater the larger upside with increased returns from the F1 hybrid seed.
References
Bayer Cropscience Canada, (2022) Cropscience Bayer website, accessed 02 February 2024,
<https://www.cropscience.bayer.ca/en/articles/2022/canola-breeding-process>
Bucat J, French B, Seymour M (2015) Can agronomy overcome yield penalty of retained (F2) hybrid TT canola in the
low rainfall zone Farmtrials website, accessed 20 December 2023, < https://grdc.com.au/resources-andpublications/grdc-update-papers/tab-content/grdc-update-papers/2023/02/new-genetics-for-improved-canolaestablishment>
Butler DG, Cullis BR, Gilmour AR, Gogel BJ, Thompson R (2023) ASReml-R Reference Manual Version 4.2 VSN
International Ltd, Hemel Hempstead, HP1 1ES, UK
Clayton GW*, Brandt S, Johnson EN, O’Donovan JT, Harker KN, Blackshaw RE, Smith EG, Kutcher HR, Vera C,
Hartman M (2009) Comparison of Certified and Farm-Saved Seed on Yield and Quality Characteristics of Canola
Craig S Birchip Cropping Group (2013), Farmtrials website, accessed 19 December 2023,
<https://www.farmtrials.com.au/trial/16661>
French RJ, Seymour M, Malik RS (2016) Plant density response and optimum crop densities for canola (Brassica
napus L.) in Western Australia. Crop & Pasture Science 67, 397–408.
Kudnig RJ, (2021) Pacific Seeds Hybrid F1 Canola vs F2 Retained Seed Guide
Pacific Seeds website, accessed 20 January 2024, <https://www.pacificseeds.com.au/wpcontent/uploads/2021/09/2021-Pacific-Seeds-Hyola-F1-Hybrid-vs-Retained-F2-Seed-Technote-FINAL.pdf>
Kudnig RJ, (2020) Pacific Seeds Hyola 970CL vs F2 Grower Retained Seed Technote
Pacific Seeds website, accessed 20 January 2024, <https://www.pacificseeds.com.au/wpcontent/uploads/2020/07/Hyola-970CL-vs-F2-Retained-Seed.pdf>
Kudnig RJ, (2021) Pacific Seeds, Optimising the gross return value proposition of farmer-retained OP TT vs Hybrid
CT® and TT canola with varying seed size and plant population targets, GRDC website, accessed 21 January 2024,
https://grdc.com.au/resources-and-publications/grdc-update-papers/tab-content/grdc-updatepapers/2021/02/optimising-the-gross-return-value-proposition-of-farmer-retained-op-tt-vs-hybrid-ct-and-tt-canolawith-varying-seed-size-and-plant-population-targets
Nuseed Australia website, accessed 12 January 2024, <https://nuseed.com/au/wpcontent/uploads/sites/7/2022/08/Nuseed_TechNote_Retention-of-hybrid-canola-seed.pdf>
Smith EG, Favret L, Clayton GW, Blackshaw RE, (2010) The Profitability of Seeding the F Generation of Hybrid
Canola
Strautman B, Hartmann M (2006) Weigh risks of bin-run hybrid canola, Western Producer website, accessed 21
January 2024, <https://www.producer.com/production/weigh-risks-of-binrun-hybrid-canola/>
Van Valeet S, Roe D, Madsen I, Fransen S, Llewellyn D, Tao H, WSU Extension; Dept of Crop and Soil Sciences,
WSU <https://s3.wp.wsu.edu/uploads/sites/3105/2022/08/2018-Integrating-Livestock-to-Dryland-System-Grazing-onDual-Purpose.pdf>
Acknowledgements
Paper peered by Justin Kudnig, National Technical Canola Manager, Pacific Seeds Australia.
Pacific Seeds Australia – a Subsidiary of Advanta Seeds.
Richard Devlin, Living Farms, York WA
Nic Amos, Kalyx Australia, Young NSW,
Grant Thompson, Crop Circle Consulting, Geraldton WA
Luke Marquis, Rob Hughes, SEAR, Esperance WA
Mike Lamond, SLR Agriculture York WA
Richard Porter, AgXtra, Adelaide SA
Brooke Bennett, BCG, Birchip Vic
Audrey Gripper, Southern Farming Systems, Inverleigh Vic
Barry Haskins, AgGrow Research, Beelbangera NSW
Contact Details
Andrew Heinrich, Technical Specialist Canola WA
Pacific Seeds Australia
1 Brookfield Terrace
Jane Brook WA 6056
+61 (0)473 520 818
andrew.heinrich@advantaseeds.com
Willow Liddle, Jnr Canola Breeder.
Pacific Seeds Australia
268 Anzac Avenue
Toowoomba, Qld, 4350
+61 (0)455 746 186
willow.liddle@advantaseeds.com
Justin Kudnig, National Canola Technical Manager.
Pacific Seeds Australia
35 Albert Street
Highett, Melbourne, Vic, 3190
+61 (0)408 408 616