Download The

Agronomic and financial outcomes associated with various plant population targets across different Spring canola hybrids.
Justin Kudnig, Andrew Heinrich, and Willow Liddle, Pacific Seeds, Melbourne, Perth, and Toowoomba.
Key Words
Canola hybrid, plant populations, yield depression. maximising grower returns, plants/m2, value equations, and grain yield.
Key messages
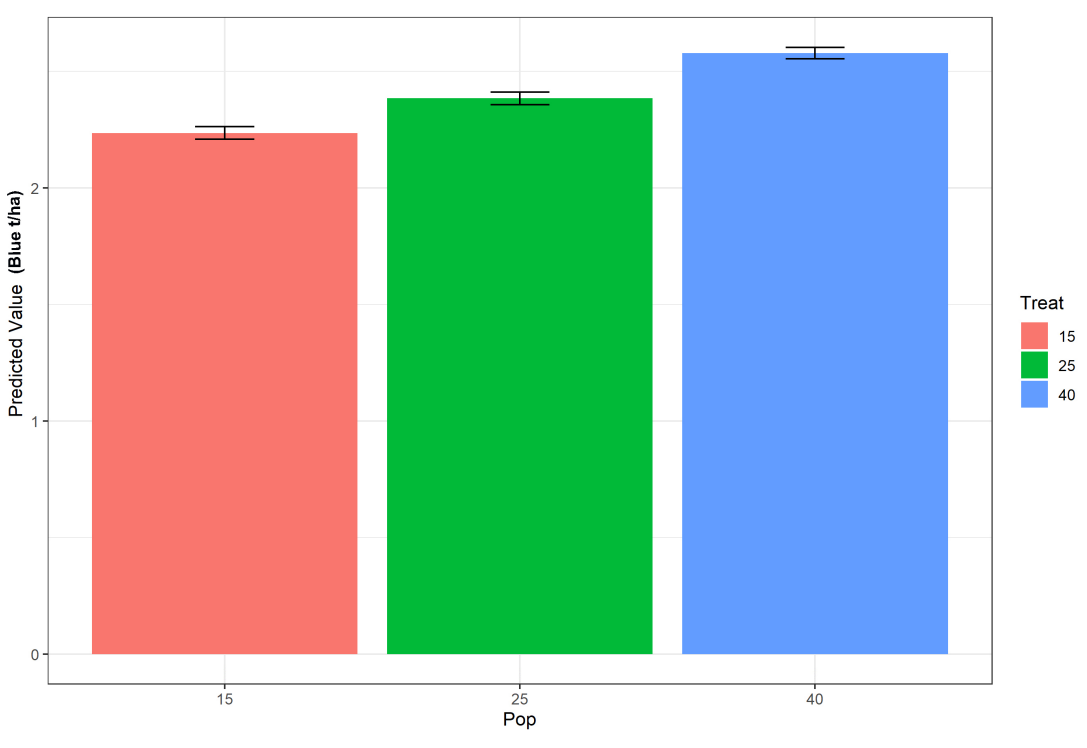
- Targeting canola population densities of F1 hybrids as close as practical to 40 plants/m2 maximises grain yield across various growing environments and potential grain yields.
- Maintaining higher established canola populations of F1 hybrids towards 40 plants/m2 maximises grower returns above 1.0t/ha, with increased returns up to $217/ha.
- Inherent dual-stacked or single herbicide tolerance of canola hybrids did not affect optimum plant population density.
Aims
This research examines the differences in plant establishment, grain yield, and economic returns when comparing 15 vs 25 vs 40 plants/m2 target populations across dual-stacked and single-tolerant Spring canola hybrids in Australian canola growing environments.
Introduction
Australian canola growers and agricultural advisors have been seeking increased scientific information and recommendations for hybrid canola crops on different target plant populations and their relative impact on plant establishment, grain yield, and resulting income. Five hybrid varieties and one experimental hybrid with a range of single or stacked herbicide tolerances were assessed at 3 target population densities of 15, 25, and 40 plants/m2 .
The cost of purchasing F1 hybrid seed each year has some Australian growers and advisers strategically lowering seeding rates and effective plant populations to minimise input costs while aiming to maximise returns.
Over and above plant populations, other strategies employed have been to retain harvested grain from F1 hybrid seed into subsequent generations. However, recent work by Heinrich et al. (2024) showed the value of F1 hybrid seed compared to retained F2 seed and a blend of F1 and F2 seed, where the simplified gross margin for F1 seed was greater than retained seed. This work has highlighted the perceived need to retain F2 seed to manage input costs for growers as a false economy.
French et al. (2016) reported that field establishment in spring canola under Western Australian conditions ranges from 0.3 -1.0 of the target population, with a median value of 0.855 for the target population of 40 plants/m2 . This new research was conducted across all the key Australian canola-growing regions. Replicated field trials were planted in various environmental conditions, representing a wide range of sowing dates, seasonal temperatures, rainfall, and soil types.
Angadi et al. (2003) found that seed yield was stable in canola plant populations under Canadian conditions, with 40 – 80 plants/m2 , but it declined in populations below 40 plants/m2 . At lower plant densities, the limit of plasticity of canola and its ability to compensate may be reached, causing a substantial yield decline.
Method
15 Pacific Seeds Hyola® Innovation Systems Trials and 4 Pacific Seeds TD Hyola® Trait Tolerance Systems Trials were established for Spring-type canola across Australia, representing a diverse range of environments within the canola-growing regions in 2023.
18 trial environments were harvested with full ASReml data analysis completed, with 1 site being abandoned due to the trial having unacceptable agronomic integrity.
The 18 trial environments had a wide range of differences relating to seasonal rainfall, cropping histories, soil types, and soil pH, with a combination of Best Management Practice (BMP) and District Standard Practice (DSP) treatments applied per each location aimed at maximising potential yields for the varieties present, thus enabling a diverse set of data collection for accurate comparison.
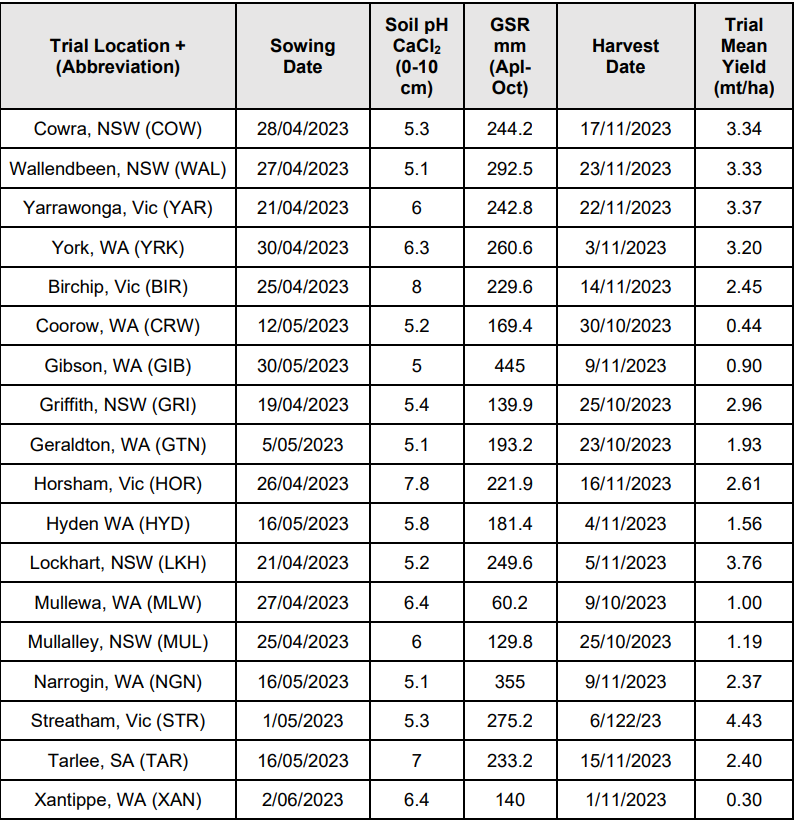
Table 1: 2023 trial locations, sowing dates, environmental records, and site mean yields.
Spring Hybrid Population Canola trials
The 3 population treatments for six Spring hybrids were embedded within the unique Hyola Innovations Systems trial design. These trials are based upon RCB spatial designs (2 reps, 12 ranges), with each of the six hybrid varieties having population targets of 15, 25, and 40 plants/m2.
The plant densities targeted at sowing for all respective population treatments were adjusted by sowing a set number of seeds per plot. Packeted seed per plot was adjusted and sown using 90% germination and a 75% establishment factorial.
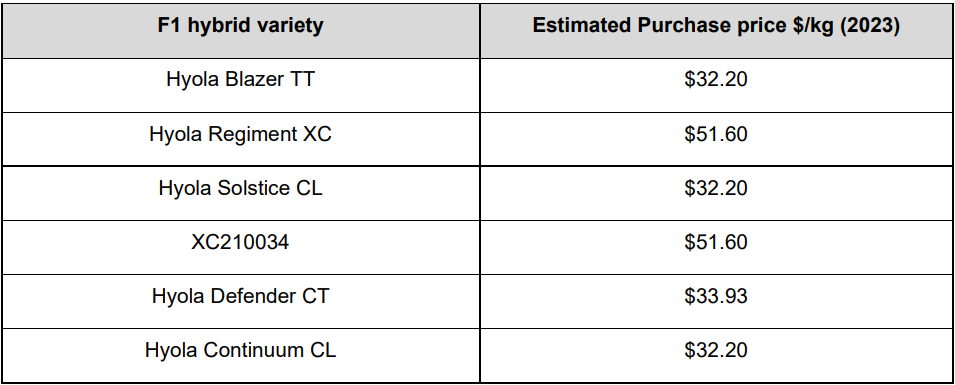
Table 2: Seed costs Hyola Spring canola hybrids, 2023.
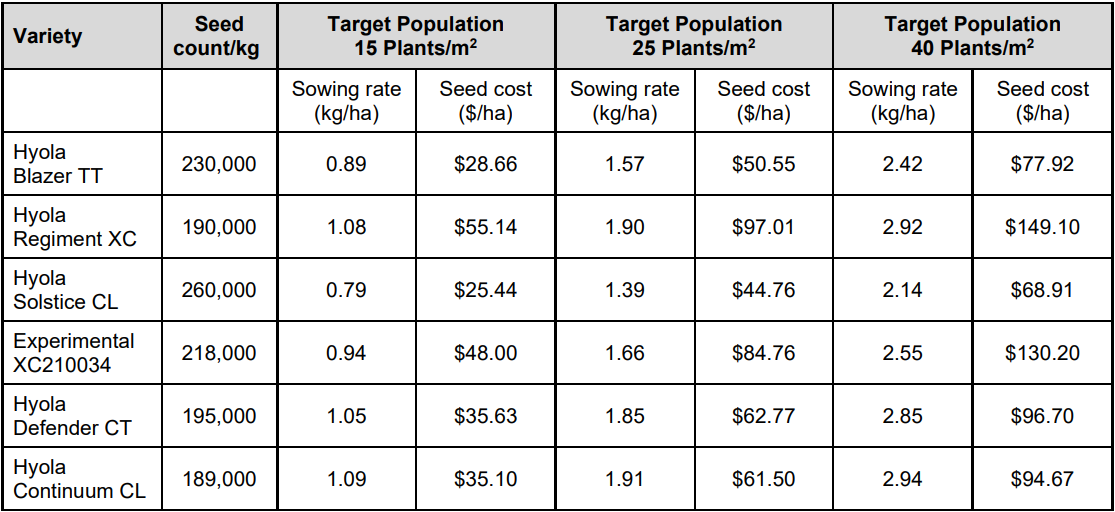
Table 3: Calculated sowing rates and seed cost per hectare.
Each variety treatment had the full registered label rate of appropriate herbicides applied at the optimum timing per the inherent herbicide tolerance or tolerances.
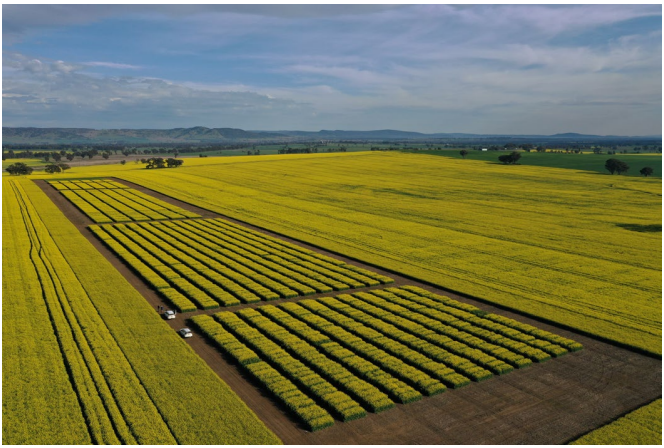
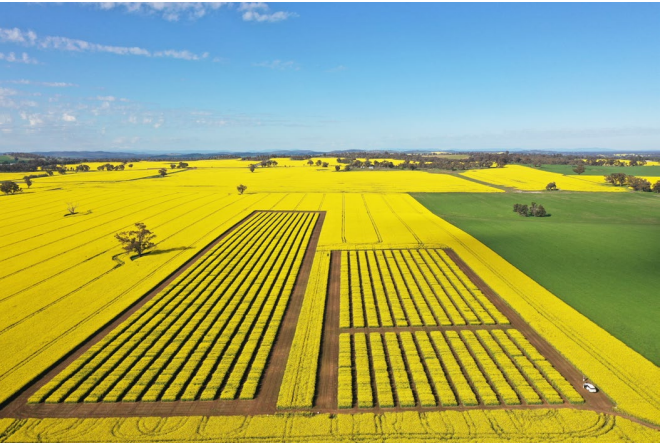
Image 1. 2023 Cowra NSW Hyola Innovation Trial site
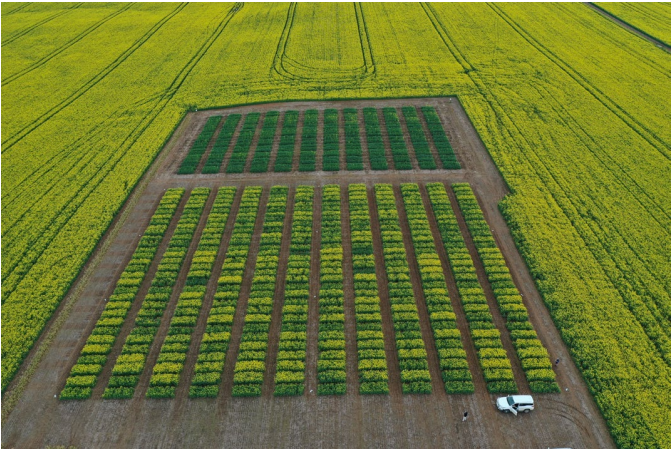
Image 2. 2023 Wallendbeen NSW Hyola Innovation trial site
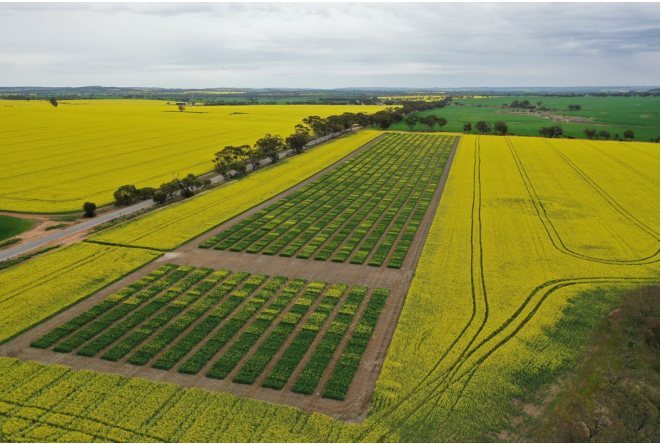
Image 3. 2023 York WA Hyola Innovation trial site
Image 4. 2023 Yarrawonga Vic Hyola Innovation trial site
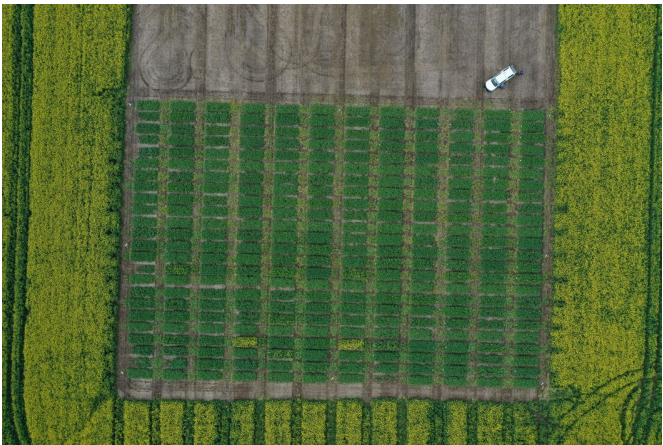
Image 5. 2023 Tarlee SA Hyola Innovation trial site
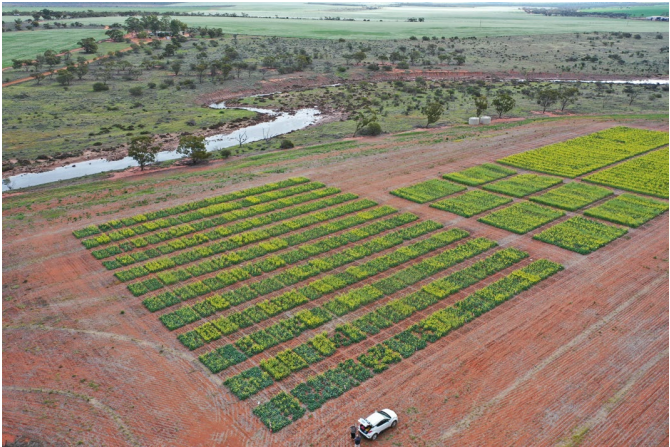
Image 6. 2023 Mullewa WA Hyola Innovation trial site
Plant establishment counts at each location were conducted at the 3-5 leaf stage (BBCH 13-16) by counting 3*1m or 4*1m rows per plot to establish plants per meter square. Some selected sites were flown by UAV (1 or 2 flights) and analysed for Green Ground cover or crop canopy percentage comparisons are provided below in Graphs 1 to 4.
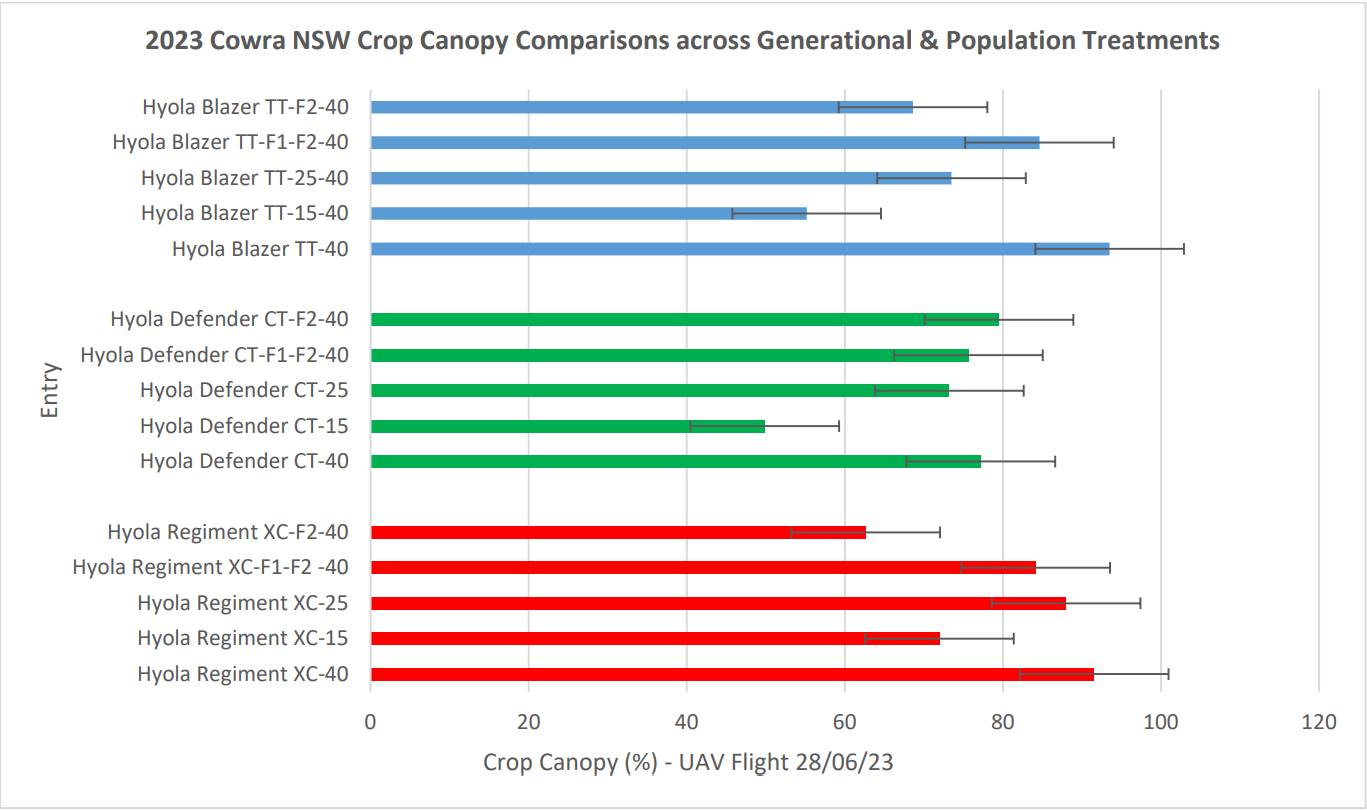
Graph 1: 2023 Cowra NSW analysed crop canopy % by variety by population treatment (LSD 2.727, p<0.05).
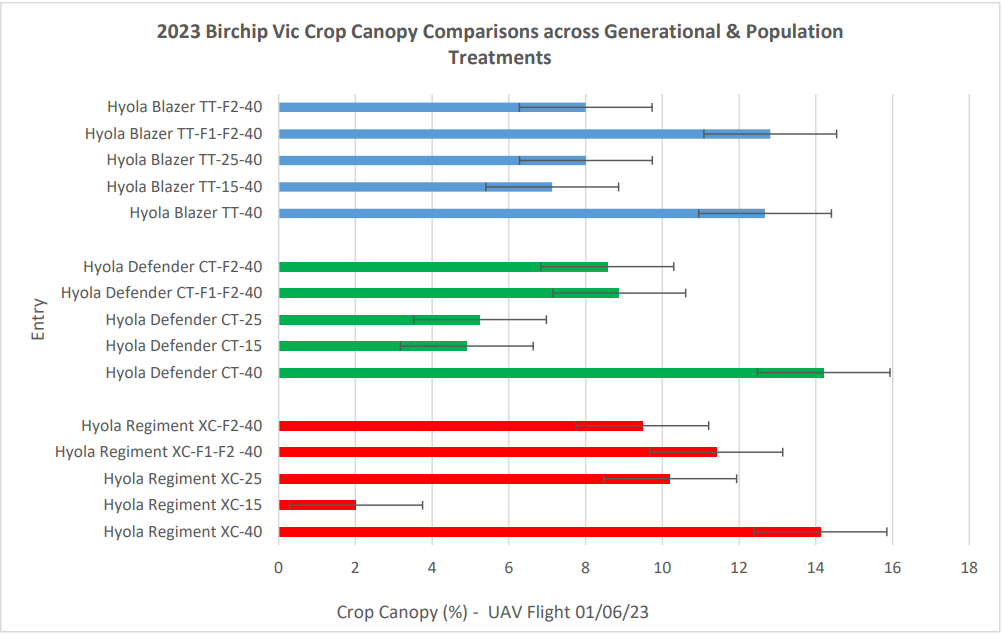
Graph 2: 2023 Birchip Vic analysed crop canopy % by variety by population treatment (LSD 1.73, p<0.05).
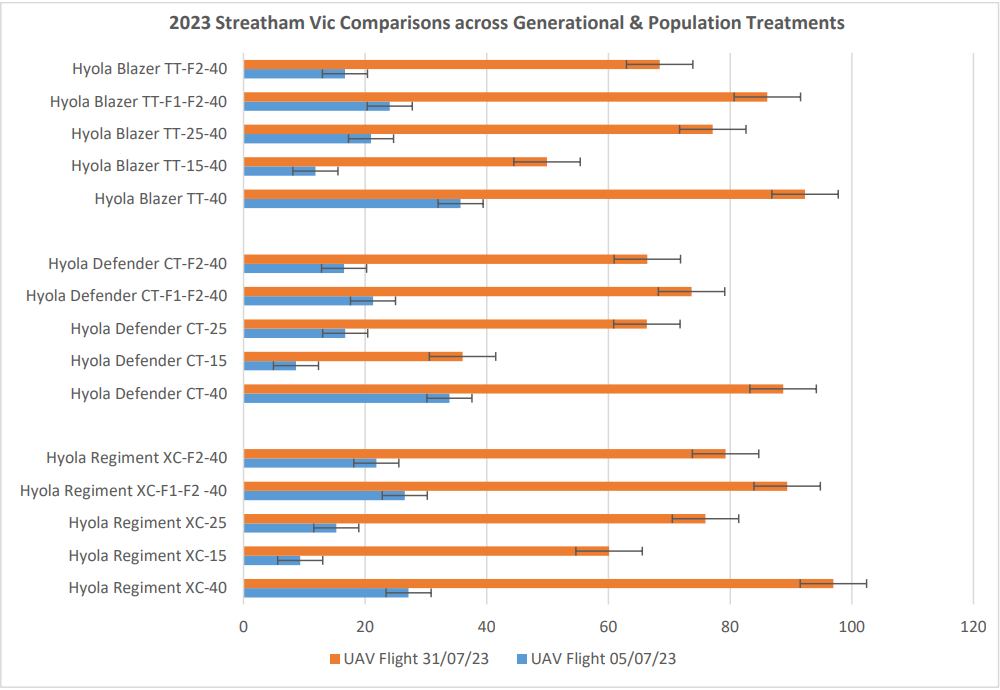
Graph 3: 2023 Streatham Vic analysed crop canopy % by variety by population treatment (LSD 5.45 & 3.70, p<0.05).
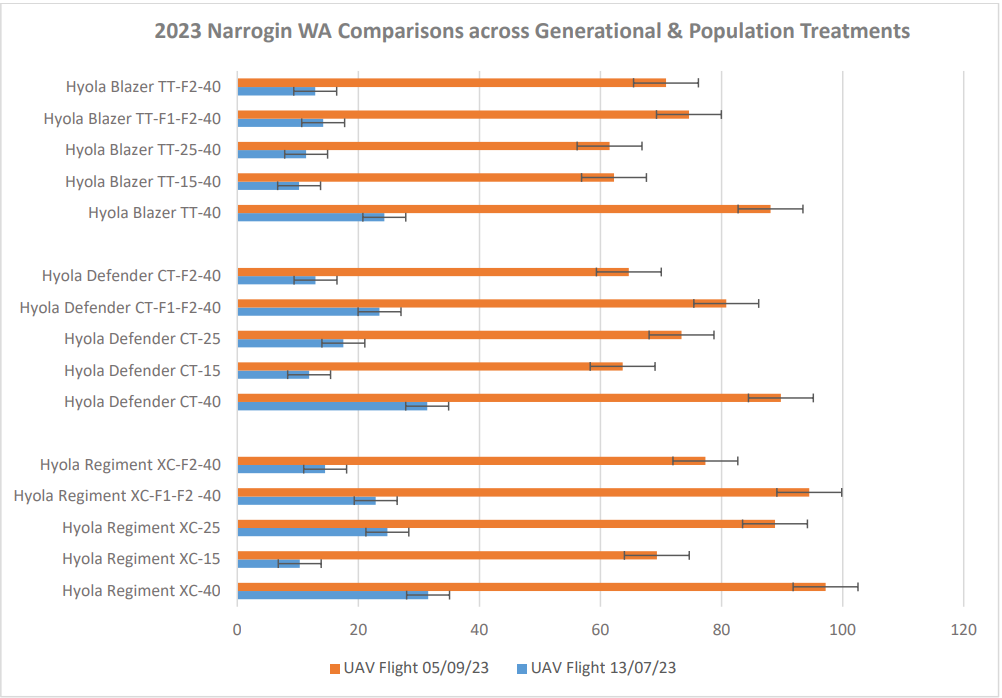
Graph 4: 2023 Narrogin WA analysed crop canopy % by variety by population treatment (LSD 5.45 & 3.70, p<0.05).
Grain yields were measured on each treatment by small plot harvesters. Grain oil percentage content is yet to be analysed, so it was not included in gross margin calculations.
A “simplified” Gross Margin (SGM) was calculated as, SGM = Grain yield * grain price – estimated seed cost. These values were used in this research as each environment will have differing input costs relative to the expected grain yield. Within each environment, the input costs for fertiliser, herbicides, etc. remained equal, irrespective of the population treatments sown. Assumptions for the value of seed and harvested grain pricing are shown in Tables 3 and 4.
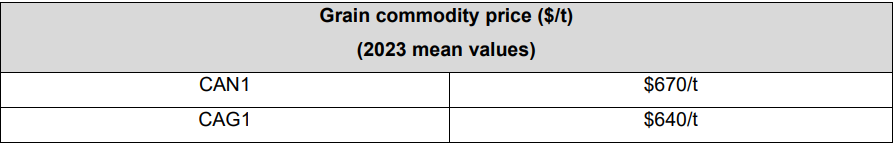
Table 4: Assumptions used for SGM calculations for Spring canola commodity with prices averaged between
Geelong and Kwinana Ports for 12 months Jan – Dec 2023 Australia
Population and yield analysis for single sites were performed fitting variety, and population, as fixed linear factors and spatial adjustments were performed using the auto-regressive mode, hence, giving a BLUE output for each site. Statistical reference: Using ASReml (Butler et al., 2023).
Results and discussion
Spring hybrid canola plant establishment
Concerning plant establishment, French et al. (2016) showed that canola field establishment varied from 0.3 to 1 (30-100%) and was higher at a low target density with a median of 0.585 at a target density of 40 plants/m2. This trend in higher field establishment at lower target populations was repeated in this research but with a narrower range of percentage establishment differences between target population treatments.
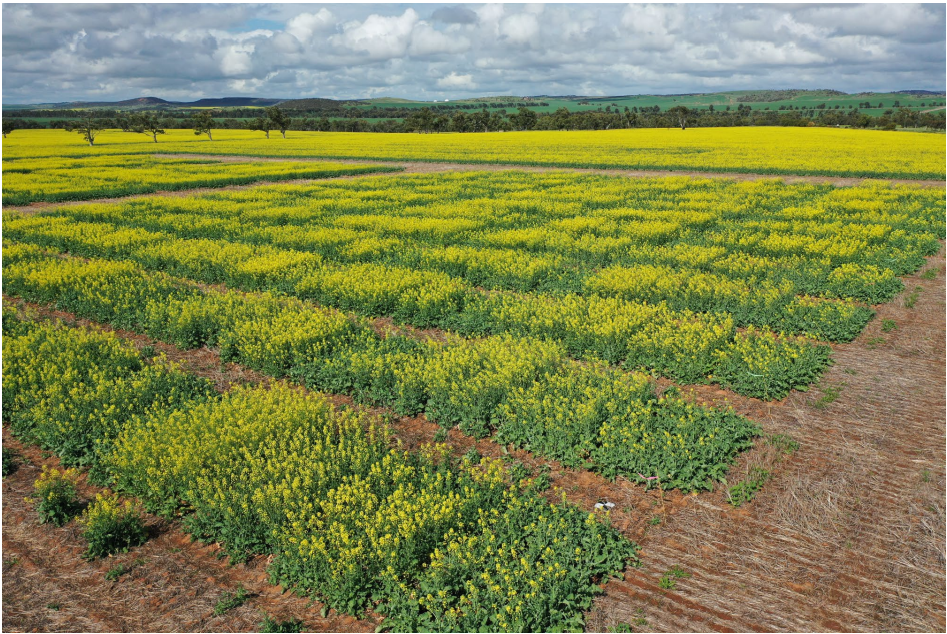
Image 7. 2023 Geraldton WA Hyola Innovation trial site
These trials experienced a range of establishment conditions but showed only a relatively narrow range between 66-79% of the target population as shown in Table 5 in contrast to previously reported research.
This research achieved a mean establishment of 72% for the target population density of 40 plants/m2, 75% for the target population density of 25 plants/m2, and 76% for the target population density of 15 plants/m2 across all varieties.
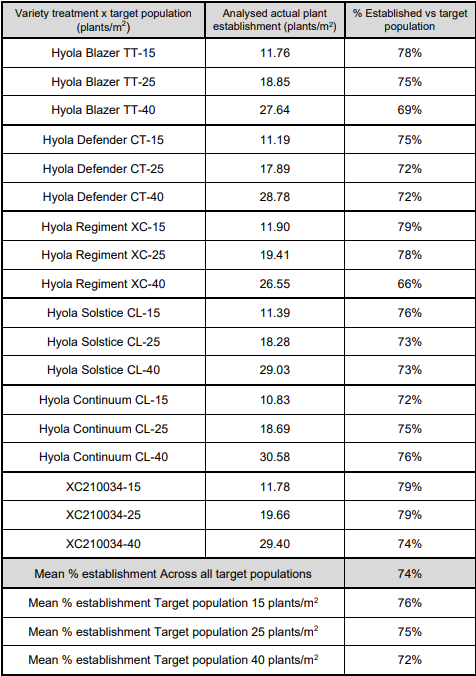
Table 5: Analysed plant density achieved across population treatments.

Graph 5: Analysed established plant density by variety by population treatment (Mean + SE, p<0.05).
Graph 5 shows significant differences between 15, 25, and 40 plants/m2 targets in all 6 varieties across 18 locations. When considering varieties, no significance in establishment was found within the 15 and 25 plants/m2 population target treatments across the 18 environments.
Differences in analysed plant establishment counts were identified between varieties in the 40 plants/m2 target population treatments. However, there was no clear trend relating to herbicide tolerance traits, or the related varietal seed count/kg (see Table 3 for seed count/kg).
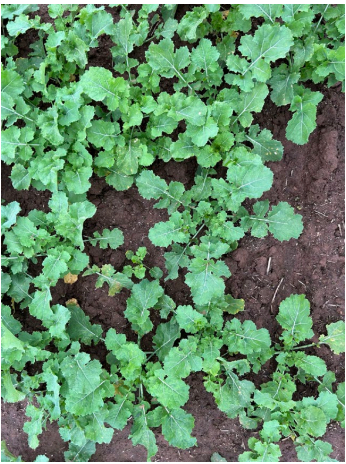
Image 8. 2023 Yarrawonga Vic Trial
Hyola Regiment XC – 15 plants/m2
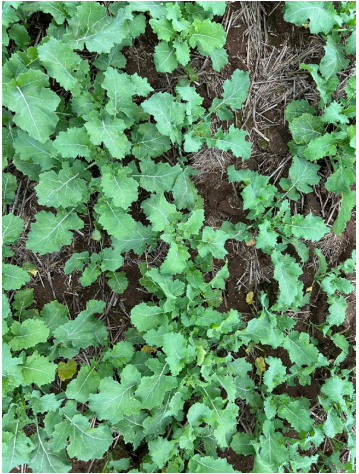
Image 9. 2023 Yarrawonga Vic Trial
Hyola Regiment XC – 25 plants/m2
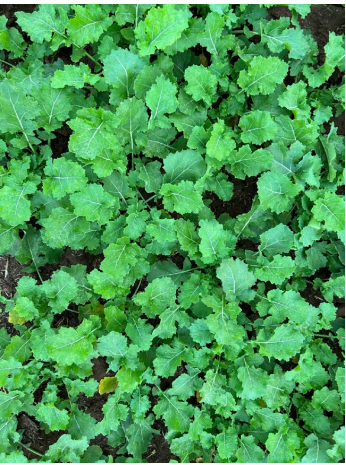
Image 10. 2023 Yarrawonga Vic Trial
Hyola Regiment XC – 40 plants/m2
Spring canola grain yield
Graph 6: Analysed MET grain yields by population treatments (p<0.001) across all six hybrid varieties.
The 40 plants/m2 target significantly increased yield compared to the 25 or 15 plants/m2 targets across all environments, as shown in Graph 6 using ASReml MET analysis. The overall analysed yield increase across all hybrids and environments from 15 to 25 plants/m2 is 148 kg/ha, and from 25 to 40 plants/m2 is 194 kg/ha. This equated to a 342 kg/ha difference between 15 and 40 plants/m2.
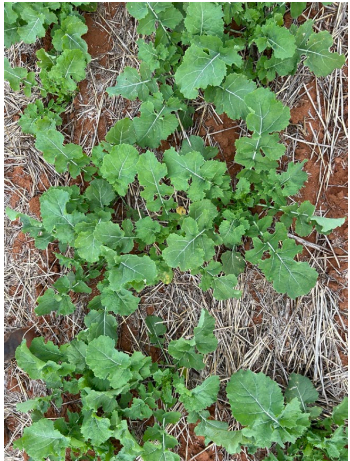
Image 11. 2023 Griffith NSW Trial
Hyola Defender CT – 15 plants/m2
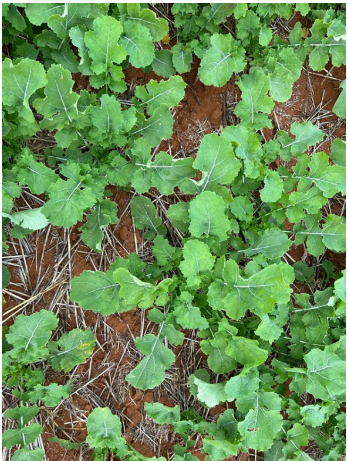
Image 12. 2023 Griffith NSW Trial
Hyola Defender CT – 25 plants/m2
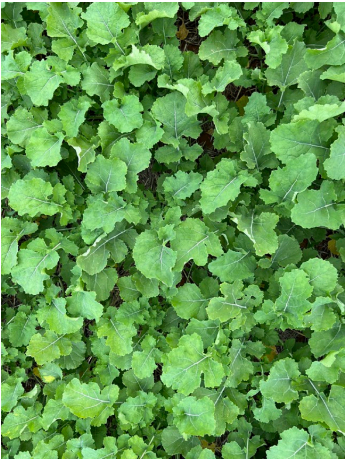
Image 13. 2023 Griffith NSW Trial
Hyola Defender CT – 40 plants/m2
Heatmap of P-Value Significance Levels
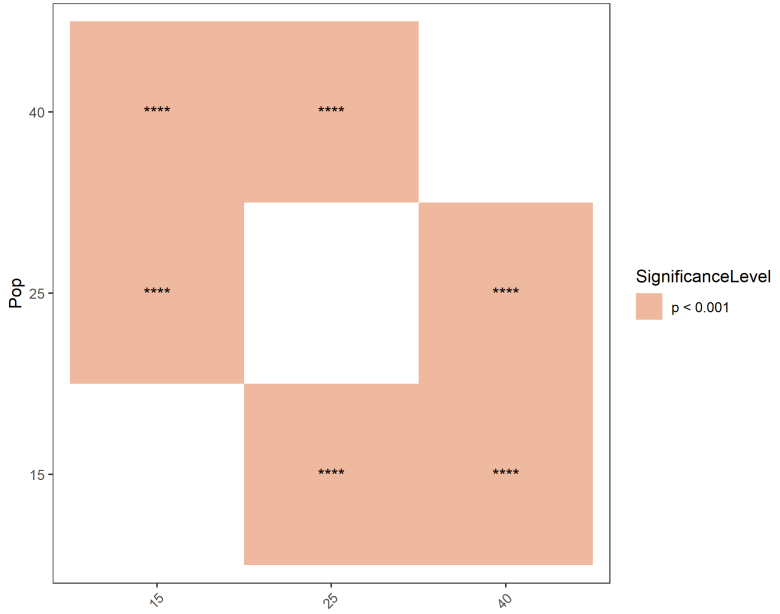
Figure 1: Yield heatmap of P-Value (p<0.001) significance level between population treatments across all varieties
Figure 1 illustrates the yield heat map of significance levels between all the treatments across all 18 locations, where the 40 plants/m2 treatment provided significantly higher yields than the 25 and 15 plants/m2 treatments. The 25 plants/m2 treatment also yielded significantly higher than the 15 plants/m2 treatment across all environments and varieties.
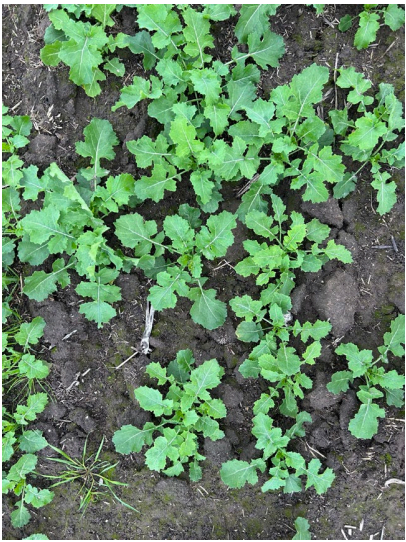
Image 14. 2023 Horsham Vic Trial
Hyola Solstice CL – 15 plants/m2
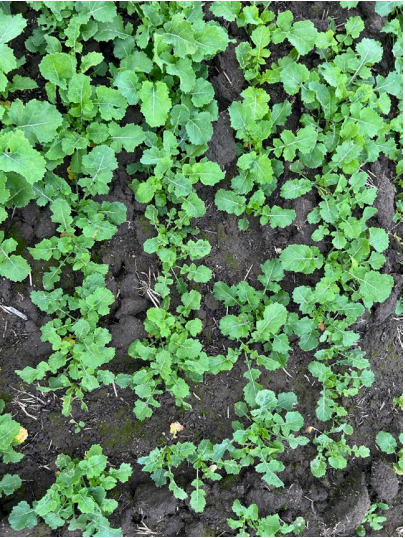
Image 15. 2023 Horsham Vic Trial
Hyola Solstice CL – 25 plants/m2
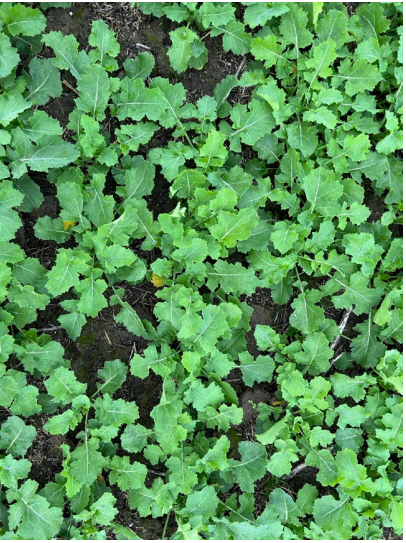
Image 16. 2023 Horsham Vic Trial
Hyola Solstice CL – 40 plants/m2
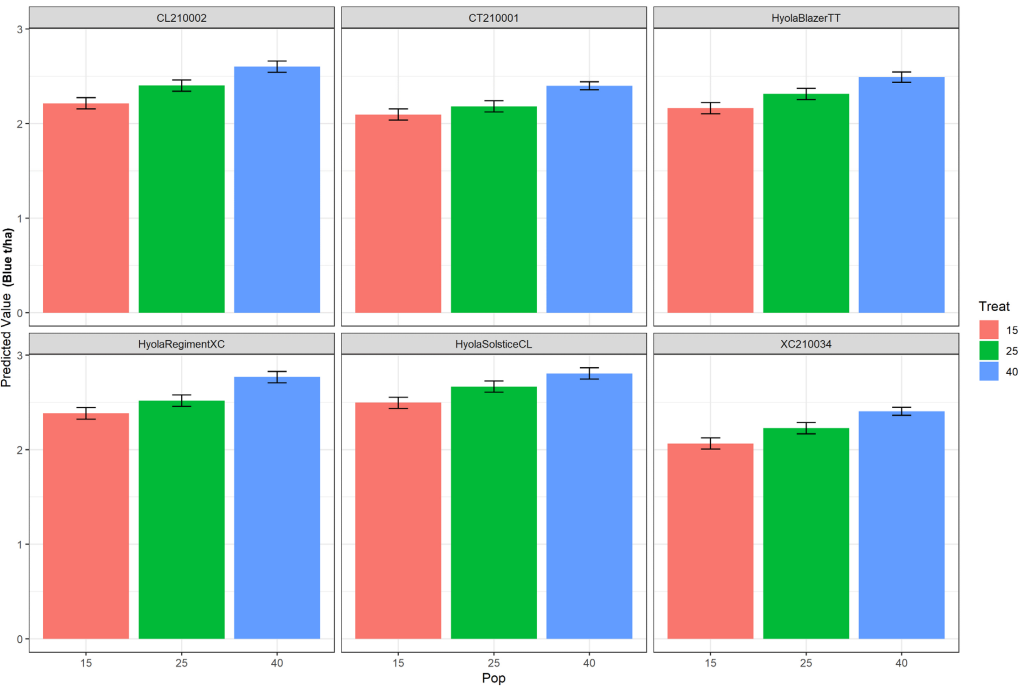
Graph 7: Analysed MET grain yields by population (p<0.001) from the 15 to 25 to 40 plants/m2 treatments for all six
hybrid varieties.
The 40 plants/m2 treatment significantly increased yield compared to 25 or 15 plants/m2 across all environments for all 6 hybrids, as shown in Graph 7 using ASReml MET analysis. The overall analysed yield increase across all environments from 25 to 40 plants/m2 treatments ranged from 139 kg/ha to 249 kg/ha, and for 15 to 25 plant/m2 treatments, ranged from 85 kg/ha to 188 kg/ha, depending on the individual hybrid.
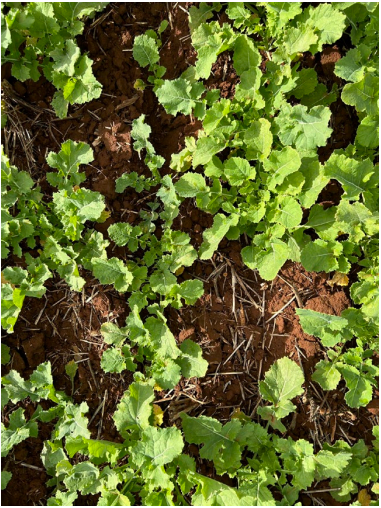
Image 17. 2023 Lockhart NSW Trial
Hyola Blazer TT – 15 plants/m2
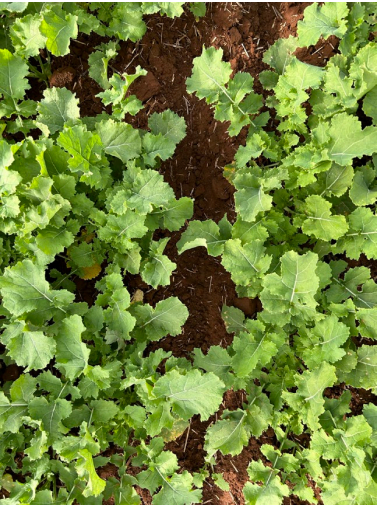
Image 18. 2023 Lockhart NSW Trial
Hyola Blazer TT – 25 plants/m2
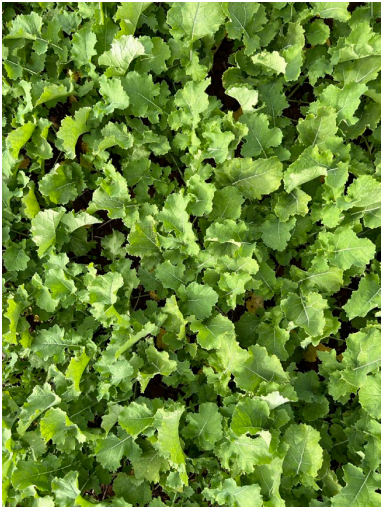
Image 19. 2023 Lockhart NSW Trial
Hyola Blazer TT – 40 plants/m2
Heatmap of P-Value Significance Levels Across Multiple Entries
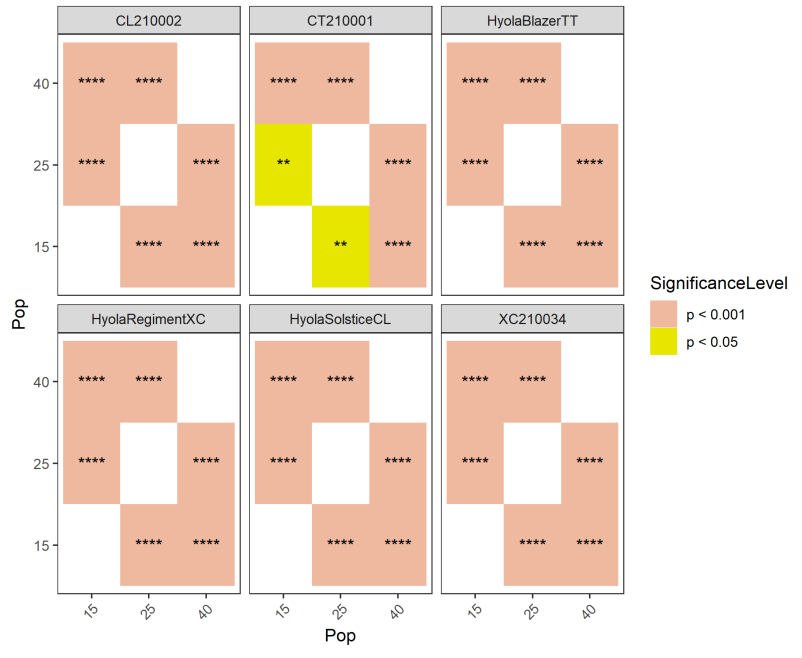
Figure 2: Yield heatmap of P-Value (p<0.001) significance level across population and variety
Figure 2 illustrates the yield heat map of significance levels between all the treatments across all 18 locations, where the 40 plants/m2 treatment provided significantly higher yields than the 25 and 15 plants/m2 treatments. The 25 plants/m2 treatment also yielded significantly higher than the 15 plants/m2 treatment across all environments and varieties.
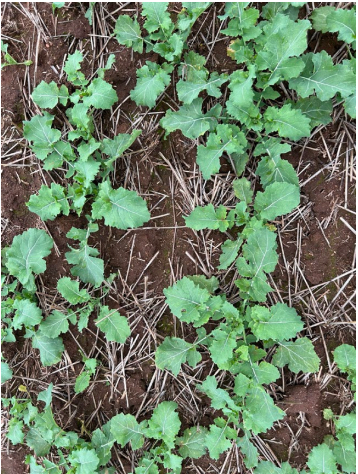
Image 20. 2023 Narrogin WA Trial
Hyola Regiment XC – 15 plants/m2
Image 21. 2023 Narrogin WA Trial
Hyola Regiment XC – 25 plants/m2
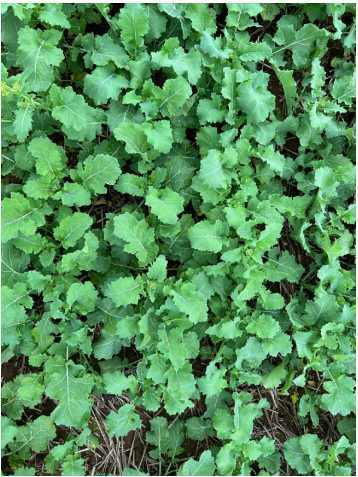
Image 22. 2023 Narrogin WA Trial
Hyola Regiment XC – 40 plants/m2
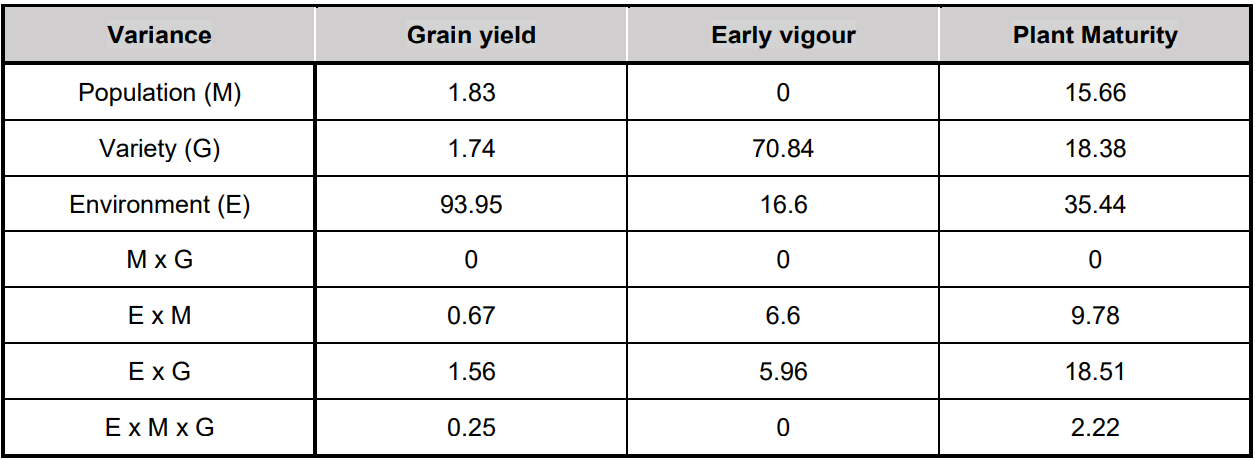
Table 6: MET table of variance.
MET analysis table of variance, Table 6, shows nearly 94% of the variation in grain yield responses can be attributed to the environmental effect, and less than 2% can be attributed to either population or variety when compared across a wide range of environments. Environment (E) often overrides and strongly influences the grain yield potential equation when comparing environments with widely different seasonal growing conditions.
This contrasts with early vigour scores, which were subjectively assessed (data not shown), where (E) attributed a much lower % variance. Variety (G) has proportionally more variance attributed to it across environments, indicating the stronger degree of influence it has on early vigour. However, the variance in plant maturity is attributed to a combination of E and G in contrast to grain yield, which is mostly (E) and early vigour, which is mostly (G).
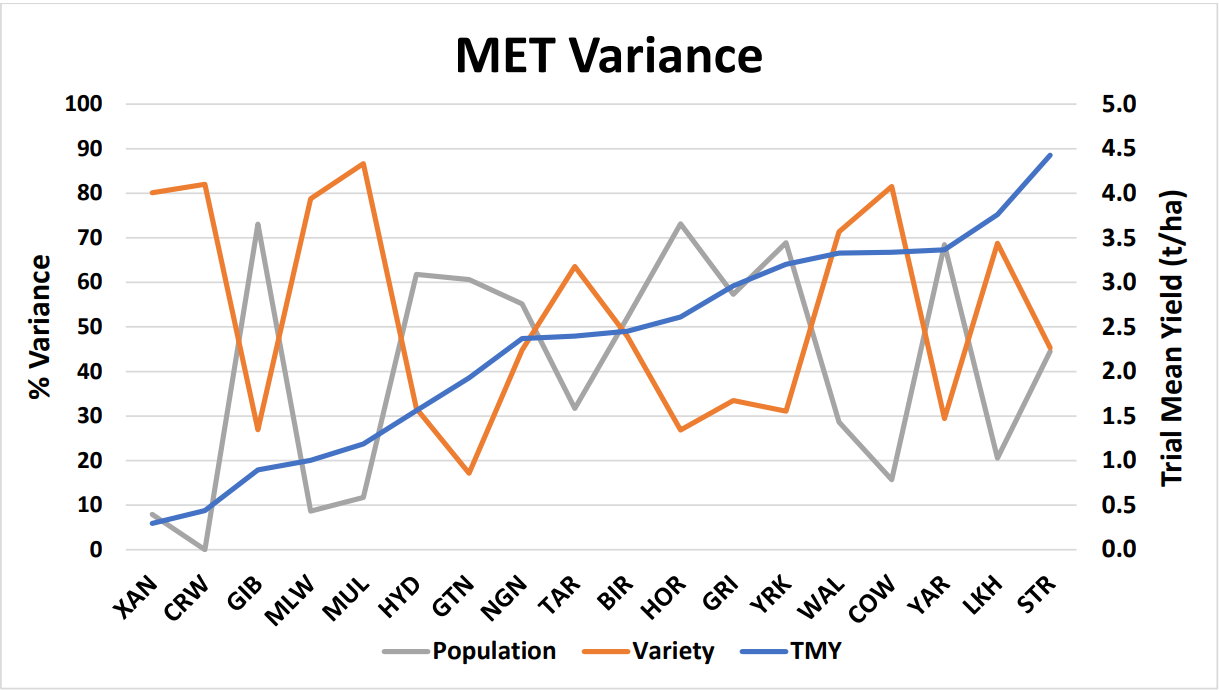
Graph 8: MET variance attributed to population and variety at single sites for grain yield.
Graph 8 shows eight environments where variance in yield attributed to Population (M) was significantly less than attributed to Variety (G), with 4 of these environments being severely droughted throughout the season (XAN, CRW, MLW, and MUL), whilst the other 4 environments (TAR, WAL, COW, and LKH) experienced a very wet finish.
Under drought conditions, the effect of E highlighted any genetic differences, whilst population had very limited influence on grain yield. Furthermore, lower populations and very limited soil water have driven more of the G influence over yield.
In contrast, with the very wet finish to the season at the remaining 4 environments, where Population (M) had low variance attributed to it, the wet finish demonstrated the stronger G influence on yield potential as water was not limited.
Image 23. 2023 Narrogin WA Trial – Hyola Regiment XC – 40 plants/m2 treatment
Image 24. 2023 Mullewa WA Trial – Hyola Innovation Systems Technology Trial
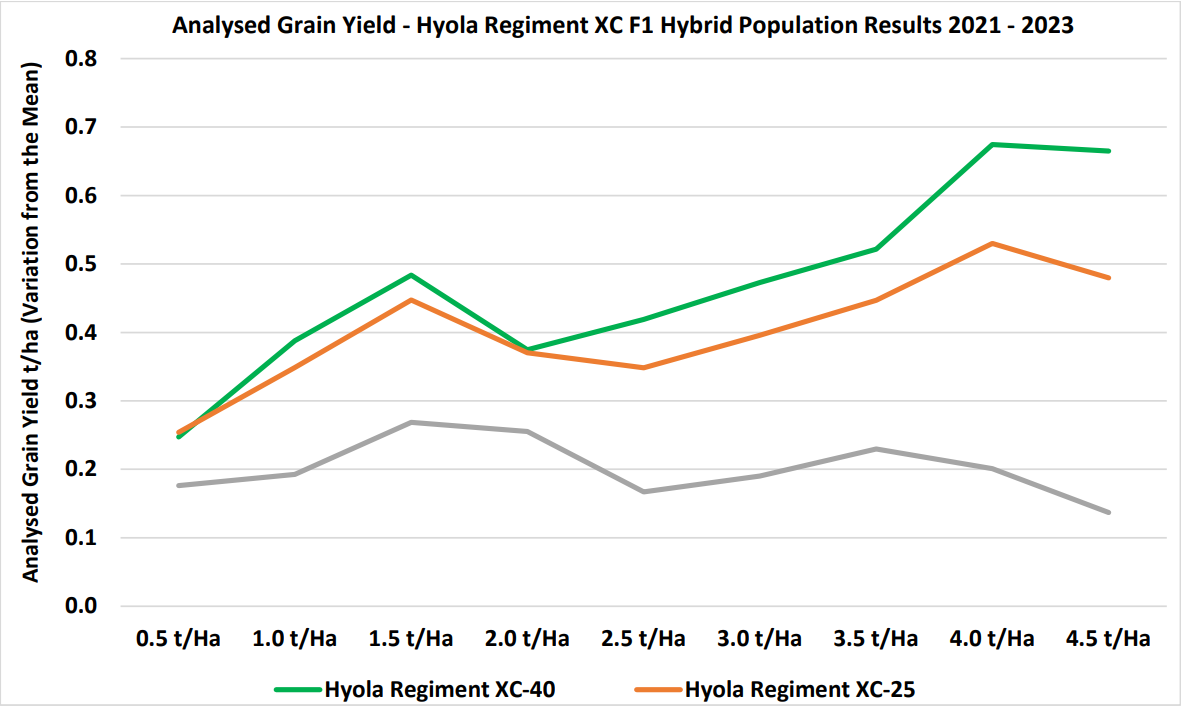
Graph 9. Analysed Hyola Regiment XC MET population treatments analysis across 0.5 t/ha trial mean yield
increments 2021-2023.
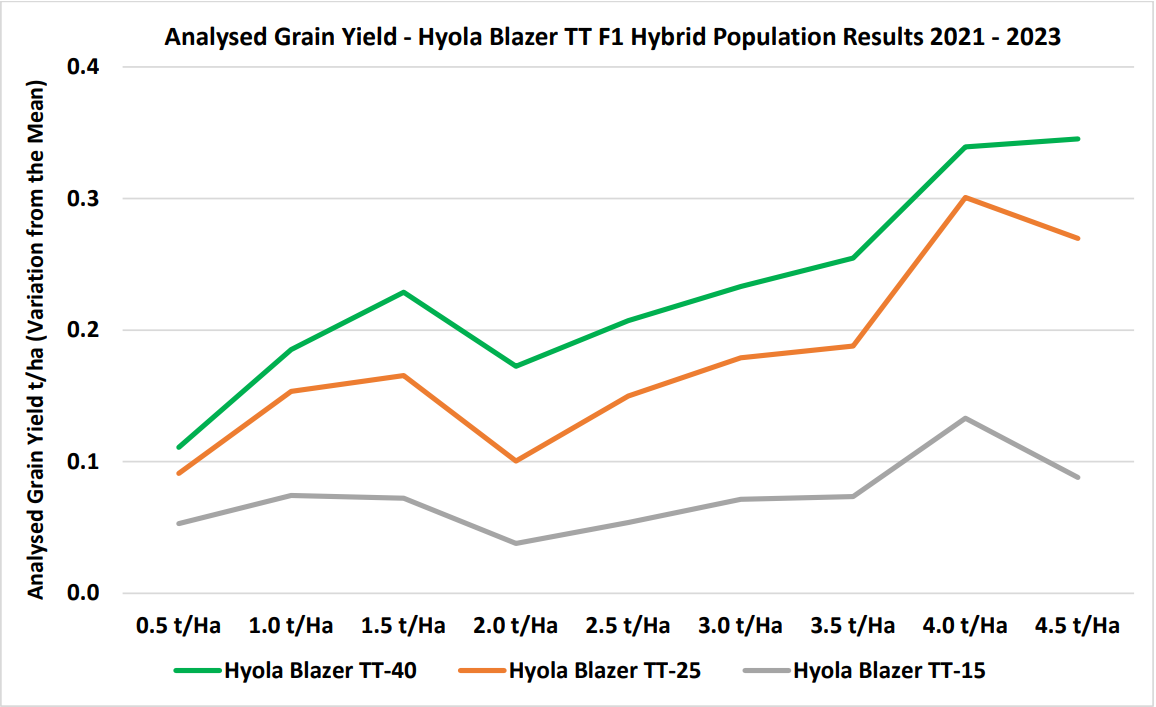
Graph 10. Analysed Hyola Blazer TT MET population treatments analysis across 0.5 t/ha trial mean yield
increments 2021-2023.
Graphs 9 and 10 show the analysed MET population treatment by yield relationships for Hyola Regiment XC and Hyola Blazer TT, 2 commercial hybrids with distinctly different herbicide tolerance traits and background genetics. Both varieties show the same trends, particularly at higher yield potentials, where the higher plant population of 40 plants/m2 has a significant yield advantage over the 25 and 15 plants/m2 populations.
Spring canola simplified gross margins.
The six hybrids represent a range of herbicide tolerances available to growers, from single to dual-stacked herbicide technologies. The sowing rate (kg/ha) has been adjusted for the number of seeds per kg to achieve the target population densities. The seed cost in $/ha has been determined for each population treatment in Table 3.
The Simplified Gross Margin (SGM) was calculated by the following:
SGM = Grain Yield (t/ha) * Grain Price ($/t) – seed cost ($/ha)
As described in the Methods, all other input costs were kept equal at each site regardless of the population treatment. Therefore, the SGM validly compares $/ha gross returns where seed cost and grain price are the variables.
Graphs 7 a-f show the SGM for each hybrid at each site with a linear regression fitted to each treatment response. The SGM reflects the value of grain, so as the grain yields increase, the SGM increases in $ value.
At lower grain yield sites, the seed cost is proportionally greater than the grain value in the SGM, as this is a fixed cost per ha; consequently, at lower grain yields, the SGM of 3 population treatments converge.
At low grain yields below 0.9 t/ha, the SGM of all hybrids approach similar values in $/ha, and in the majority of cases, the SGM for the 40 plants/m2 exceeds the 25 or 15 plants/m2 treatments.
Some individual site results may vary, but this highlights the importance of using analysed MET results, rather than singlesite results for making informed decisions.
At low-yielding sites, when a complex gross margin is considered, and all production costs are included, canola may not be a profitable crop to grow, and alternative management strategies or crops should be considered.
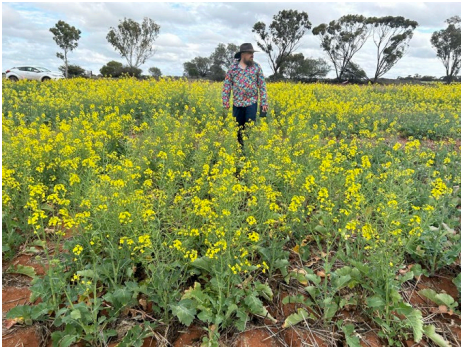
Image 25. 2023 Mullewa WA Trial
Hyola Regiment XC – 15 plants/m2
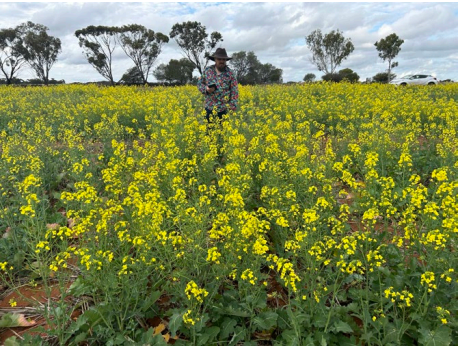
Image 26. 2023 Mullewa WA Trial
Hyola Regiment XC – 25 plants/m2
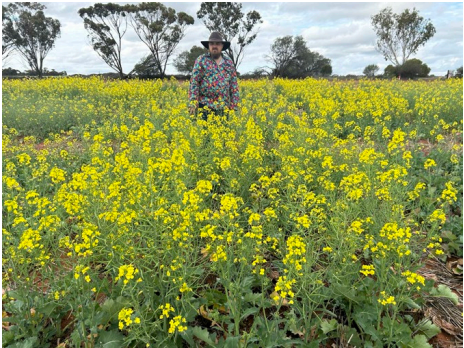
Image 27. 2023 Mullewa WA Trial
Hyola Regiment XC – 40 plants/m2
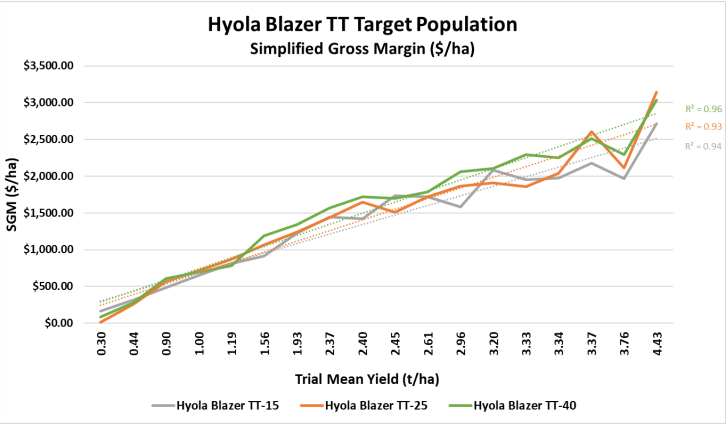
Graph 7a: Hyola Blazer TT simplified gross margin
regression for population treatment across 18 sites.
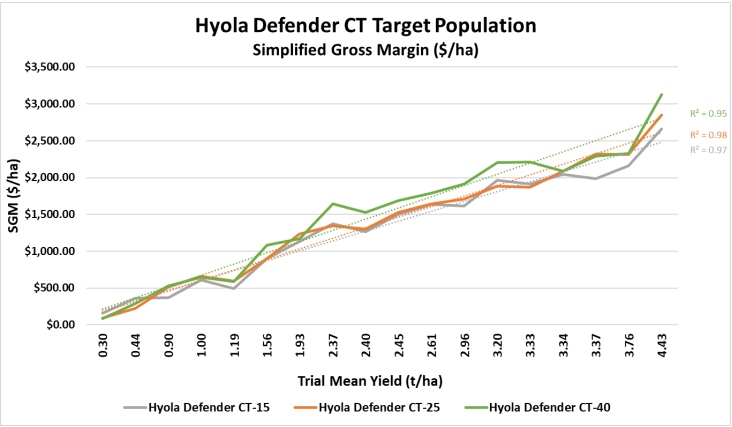
Graph 7b: Hyola Defender CT simplified gross margin
regression for population treatment across 18 sites.
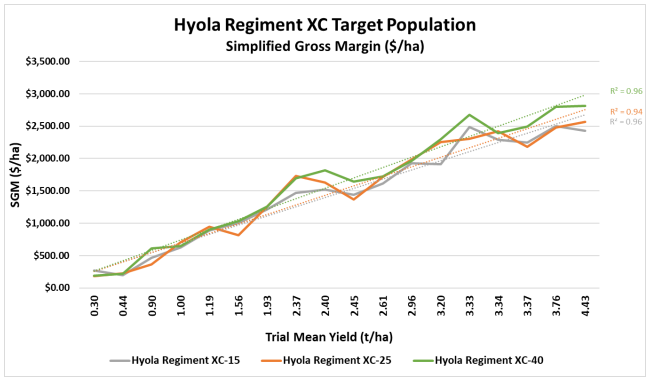
Graph 7c: Hyola Regiment XC simplified gross margin
regression for population treatments across 18 sites.
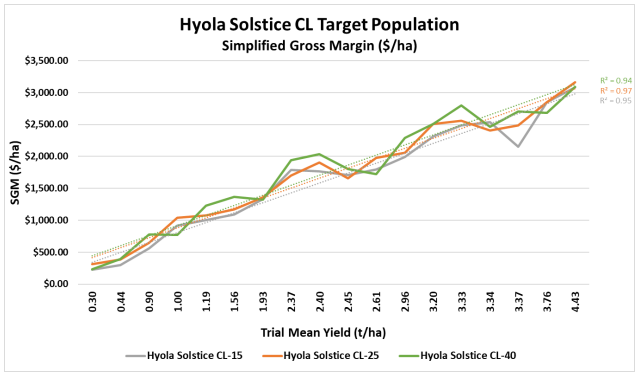
Graph 7d: Hyola Solstice CL simplified gross margin
regression for population treatment across 18 sites.
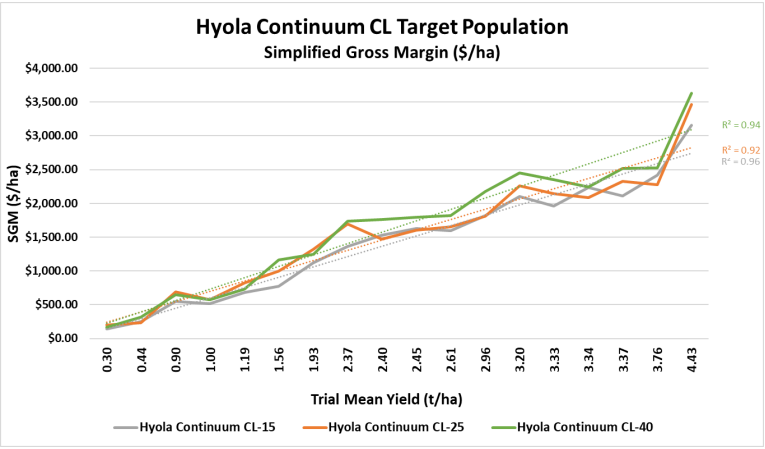
Graph 7e: Hyola Continuum CL simplified gross margin
regression for population treatment across 18 sites.
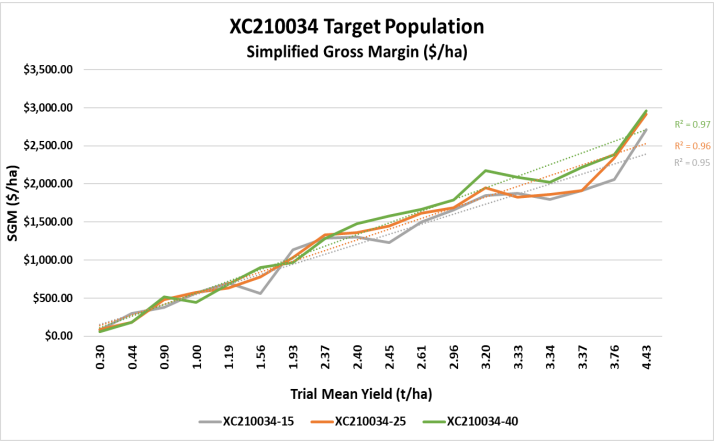
Graph 7f: XC210034 simplified gross margin
regression for population treatment across 18 sites.
Conclusion:
The value equation associated with upfront seed cost per ha drives the notion of growers wanting to reduce the sowing rate to reduce the upfront costs and potentially optimise $/ha returns. This research found that irrespective of F1 hybrid herbicide tolerance, maintaining higher plant populations towards the 40 plants/m2 target maximises the $/ha return based on the SGM calculations in environments with yields above 1.0t/ha, with increased returns up to $217/ha.
The SGM calculated in this paper does not consider any additional agronomic benefits associated with higher plant densities, such as additional weed control from crop suppression competition. Lemerle et al. (2017) cites multiple research conducted in Australia and internationally that show higher crop plant densities increase crop competitiveness and grain yield. They also further cite research outcomes showing that in Australia, canola populations of greater than 40 plants/m2 do not increase weed suppression.
References
Angadi SV, Cutforth HW, McConkey BG, Gan Y (2003) Yield Adjustment by Canola Grown at Different Plant
Populations Under Semiarid Conditions, Crop Science 43, 1358-1366
Butler DG, Cullis BR, Gilmour AR, Gogel BJ, Thompson R (2023) ASReml-R Reference Manual Version 4.2 VSN
International Ltd, Hemel Hempstead, HP1 1ES, UK
French RJ, Seymour M, Malik RS (2016) Plant density response and optimum crop densities for canola (Brassica napus L.)
in Western Australia. Crop & Pasture Science 67, 397–408.
Henrich AS, Liddle WP, (2024) https://www.pacificseeds.com.au/wp-content/uploads/2024/03/2024-Pacific-SeedsCanola-Generation-Research-Paper.pdf
Lemerle D, Luckett DJ, Hanwen Wu, Widderick MJ (2017) Agronomic Interventions for weed Management Crop
Science 95, 69-73.
Acknowledgments
Pacific Seeds Australia – a Subsidiary of Advanta Seeds.
Richard Devlin, Living Farms, York WA
Nic Amos, Kalyx Australia, Young NSW,
Grant Thompson, Crop Circle Consulting, Geraldton WA
Luke Marquis, Rob Hughes, SEAR, Esperance WA
Mike Lamond, SLR Agriculture York WA
Richard Porter, AgXtra, Adelaide SA
Brooke Bennett, BCG, Birchip Vic
Audrey Gripper, Southern Farming Systems, Inverleigh Vic
Barry Haskins, AgGrow Research, Beelbangera NSW
Contact Details
Justin Kudnig, Canola Technical Manager
Pacific Seeds Australia
35 Albert Street
Highett, Melbourne, Vic, 3190
+61 (0)408 408 616
justin.kudnig@advantaseeds.com
Andrew Heinrich, WA Technical Specialist
Pacific Seeds Australia
1 Brookfield Terrace
Jane Brook WA 6056
+61 (0)473 520 818
andrew.heinrich@advantaseeds.com
Willow Liddle, Jnr Canola Breeder.
Pacific Seeds Australia
268 Anzac Avenue
Toowoomba, Qld, 4350
+61 (0)455 746 186