Download The

What did we learn?
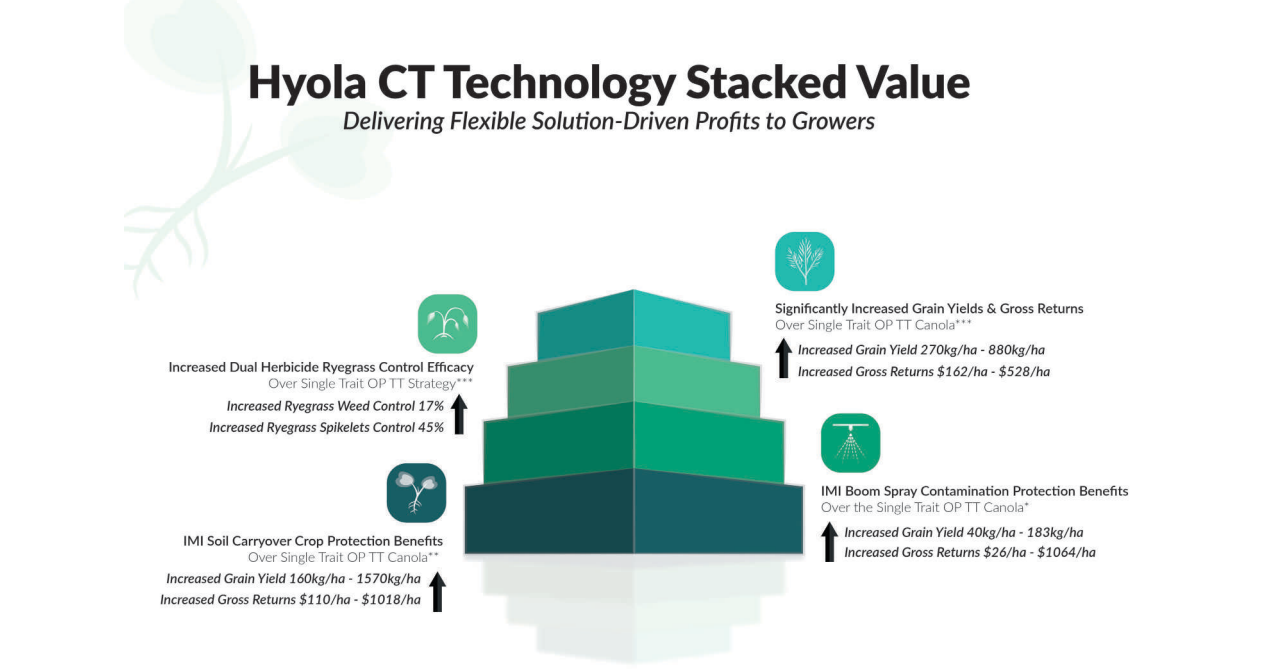
- Using Hyola CT instead of TT canola when IMI residues are present, results in better gross margins.
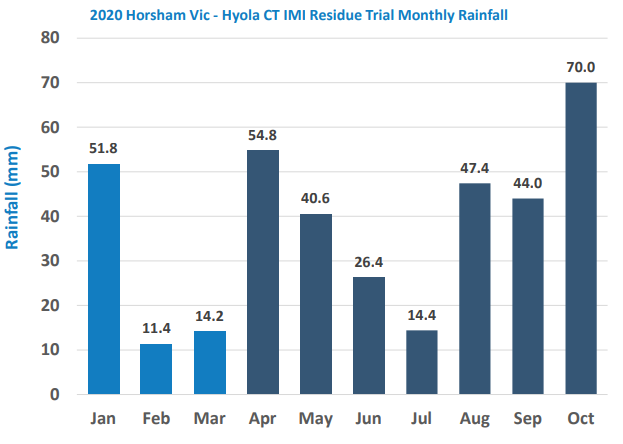
- The effect of IMI residues is greater in soils where herbicides were more mobile due to acid soils and
higher rainfall after sowing.
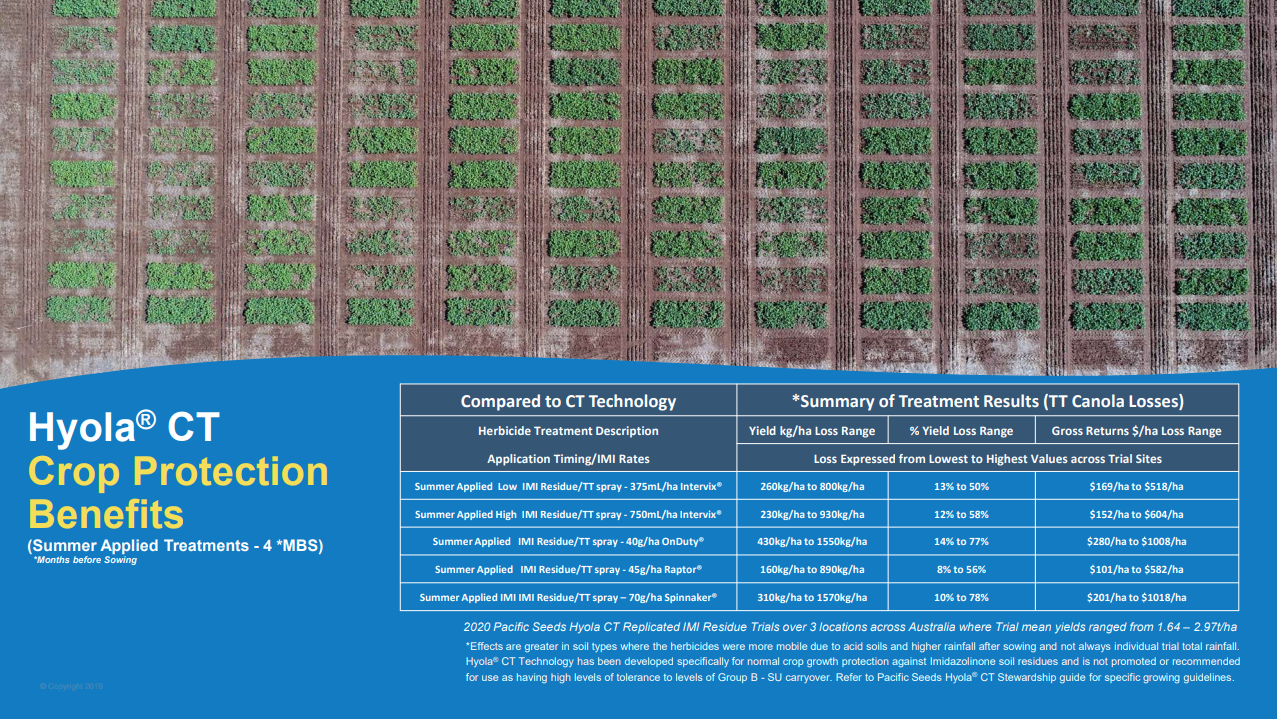
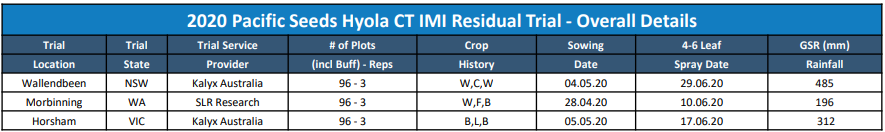
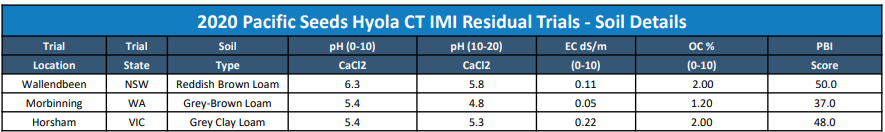
In 2020, data from three sites in WA, NSW and VIC were analysed to understand the benefit of using Hyola canola with Clearfield® and triazine tolerant (CT) traits compared to triazine tolerant (TT) canola, when imidazolinones (IMIs) residues were present. The five treatments (figure 2) were all applied four months before sowing.
What was the establishment like?
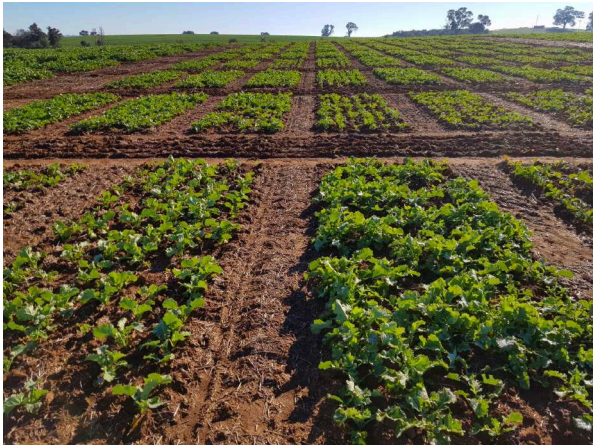
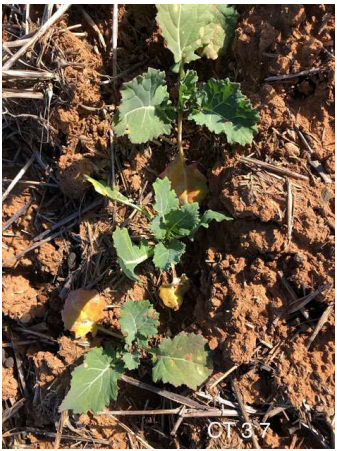
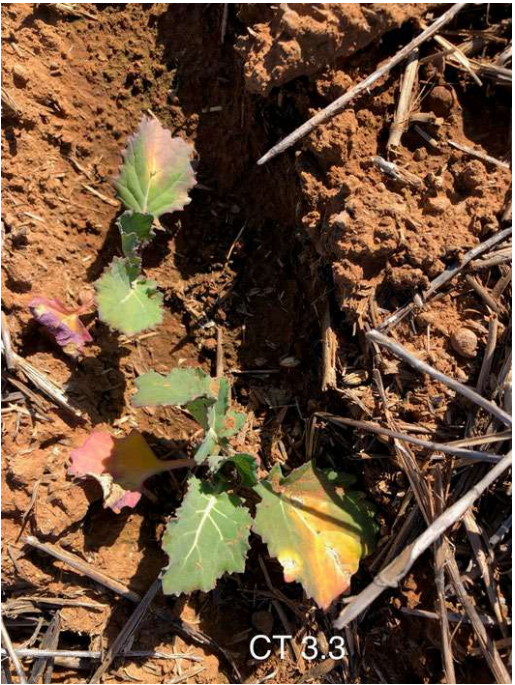
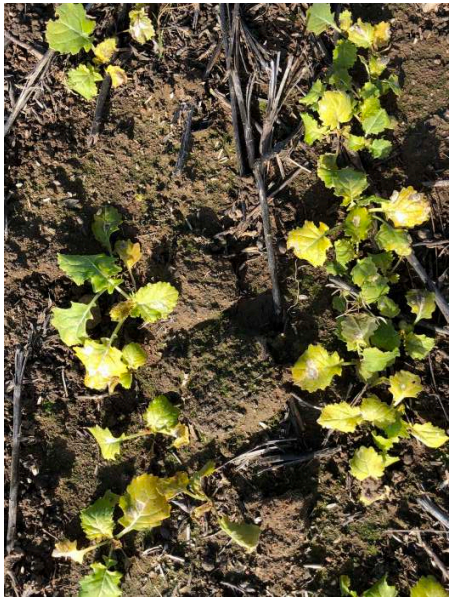
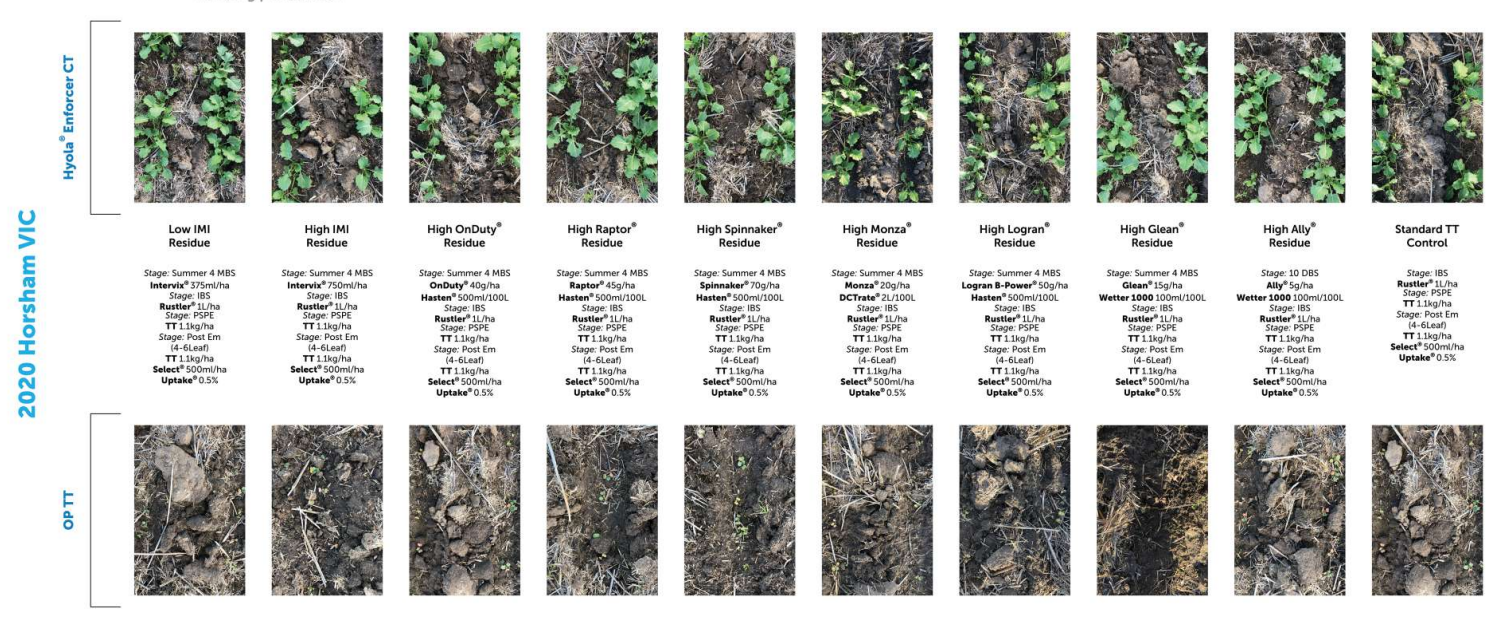
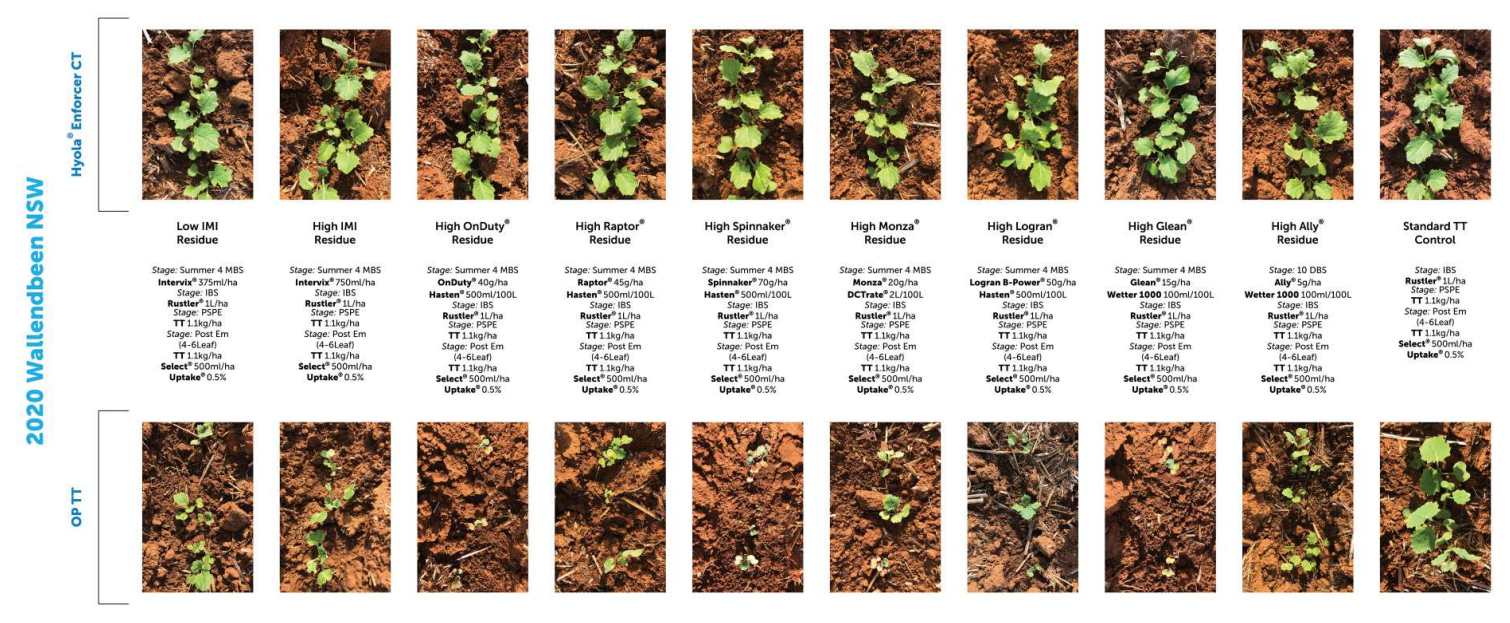
Figure 1: plant establishment was significantly better using Hyola CT rather than TT when IMI residues were present.
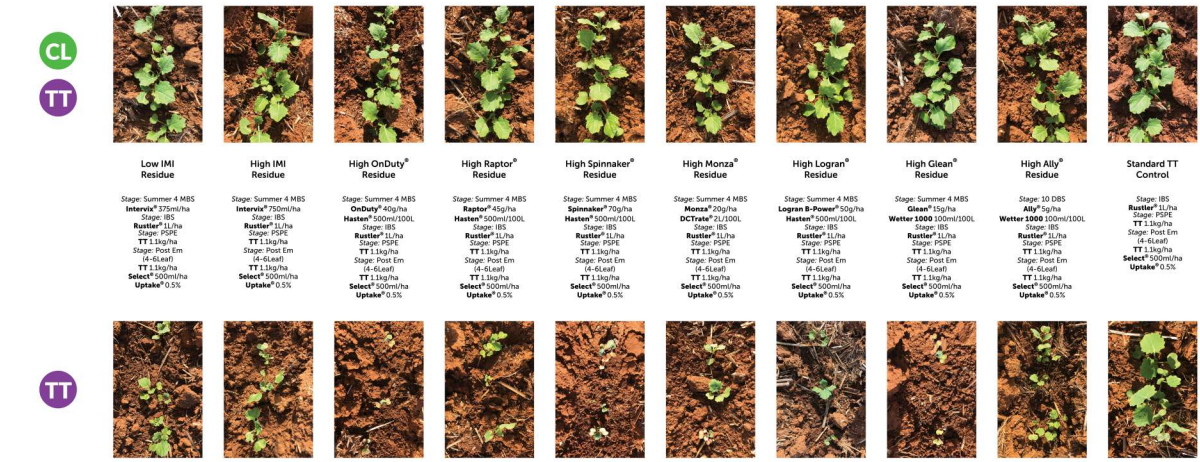
Across the three trials, the TT plots had less plants establish and they were less developed than the Hyola CT. The extent of effect of the IMI residue varied between sites, with Wallendbeen the least affected and Horsham, the most affected. In general, the OnDuty and Spinnaker treatments had the poorest establishment in these trials.
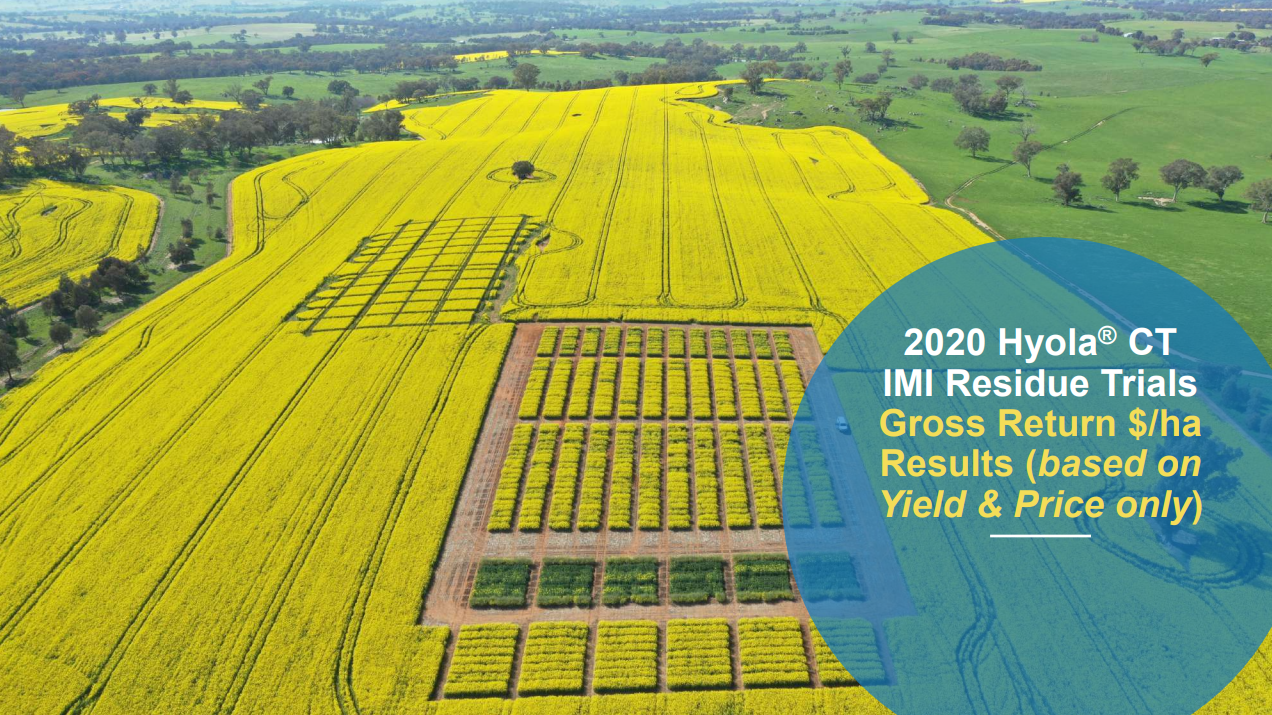
What about the gross returns?
Figure 2: while all the IMI treatments resulted in TT canola gross return losses, the OnDuty and Spinnaker residues caused the greatest TT losses.
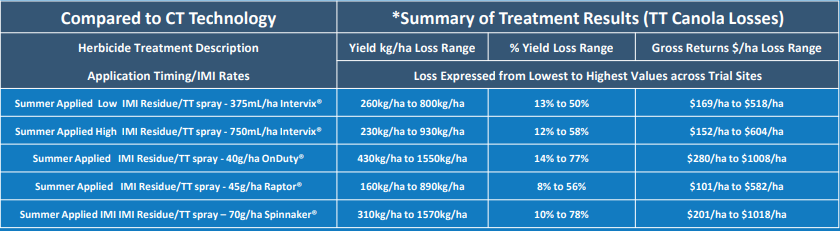
The degree of gross return losses for TT compared to CT varied between sites and treatments, with Horsham having the greatest losses and Wallendbeen the least. The effects of the IMI residue was greater in soil types where the herbicides were more mobile due to acid soils and higher rainfall after sowing.
To access the technical document, download the research.
2020 Hyola® CT IMI Residue Trial – Agronomic Details
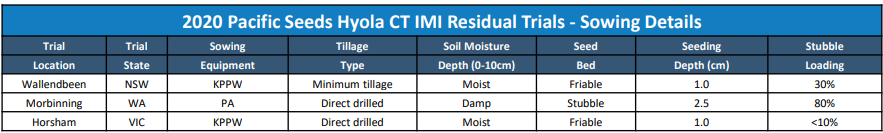
2020 Hyola® CT IMI Residue Trials - Rainfall Distribution Details
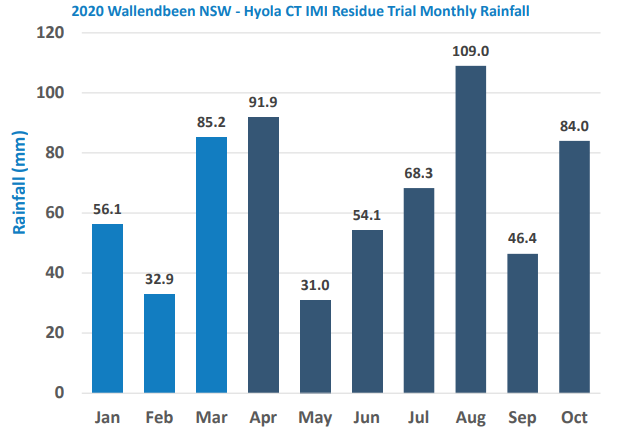
2020 Wallendbeen NSW - Hyola CT IMI Residue Trial Monthly Rainfall
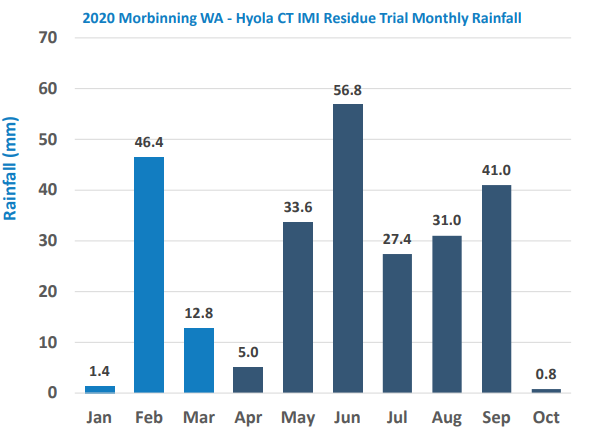
2020 Morbinning WA - Hyola CT IMI Residue Trial Monthly Rainfall
2020 Hyola® CT IMI Residue Trials - Rainfall Distribution Details
2020 Wallendbeen NSW - Hyola CT IMI Residue Trial Monthly Rainfall
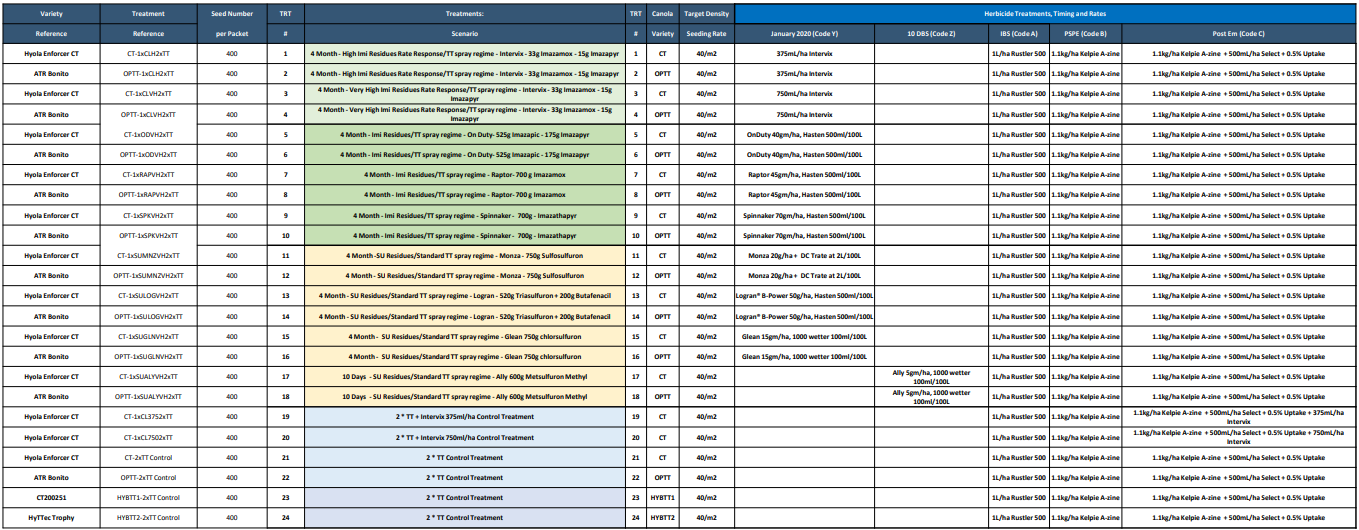
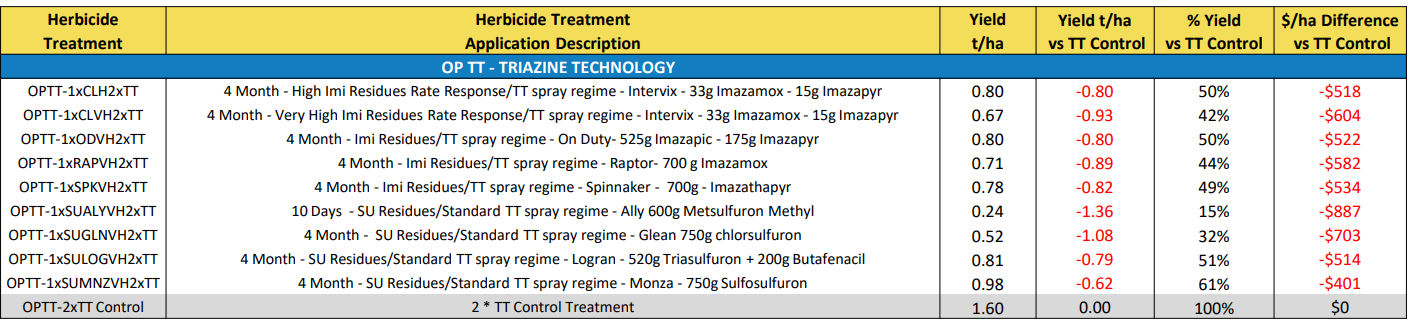
2020 Hyola® CT IMI Residue Trials – Herbicide Treatment Listing
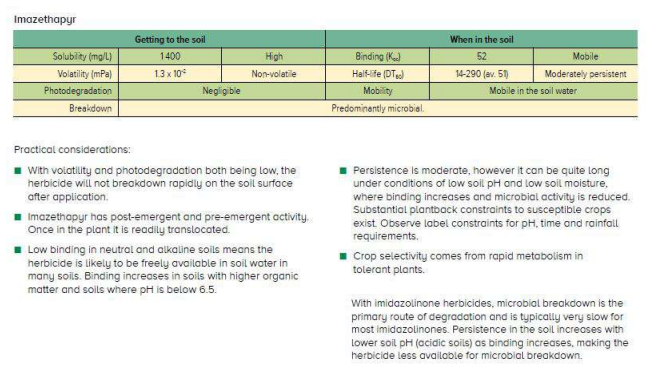
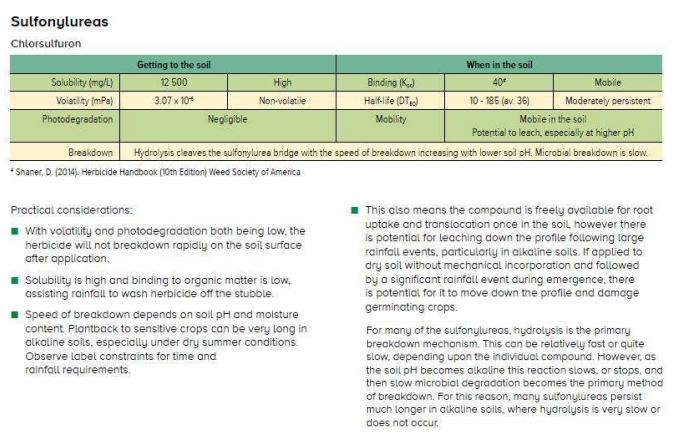
GROUP B – IMI IMIZAPIC CHEMISTRY GENERAL PROPERTIES – ALS INHIBITORS
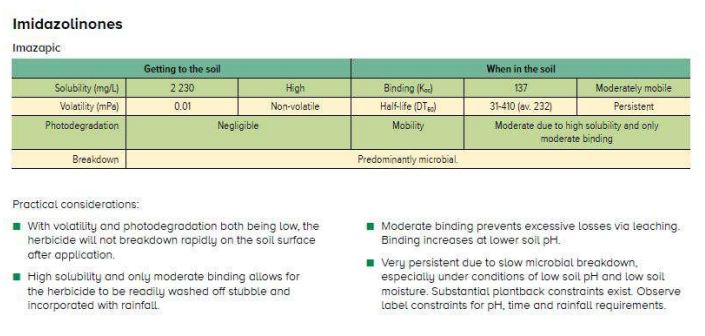
Source: 2019 GRDC PUBLICATION - SOIL BEHAVIOUR OF
PRE-EMERGENT HERBICIDES IN AUSTRALIAN FARMING SYSTEMS
GROUP B – IMI IMIZAPYR CHEMISTRY GENERAL PROPERTIES – ALS INHIBITORS
Source: 2019 GRDC PUBLICATION - SOIL BEHAVIOUR OF PRE-EMERGENT HERBICIDES IN AUSTRALIAN FARMING SYSTEMS
GROUP B – IMI IMIZAPYR CHEMISTRY GENERAL PROPERTIES – ALS INHIBITORS
Source: 2019 GRDC PUBLICATION - SOIL BEHAVIOUR OF PRE-EMERGENT HERBICIDES IN AUSTRALIAN FARMING SYSTEMS
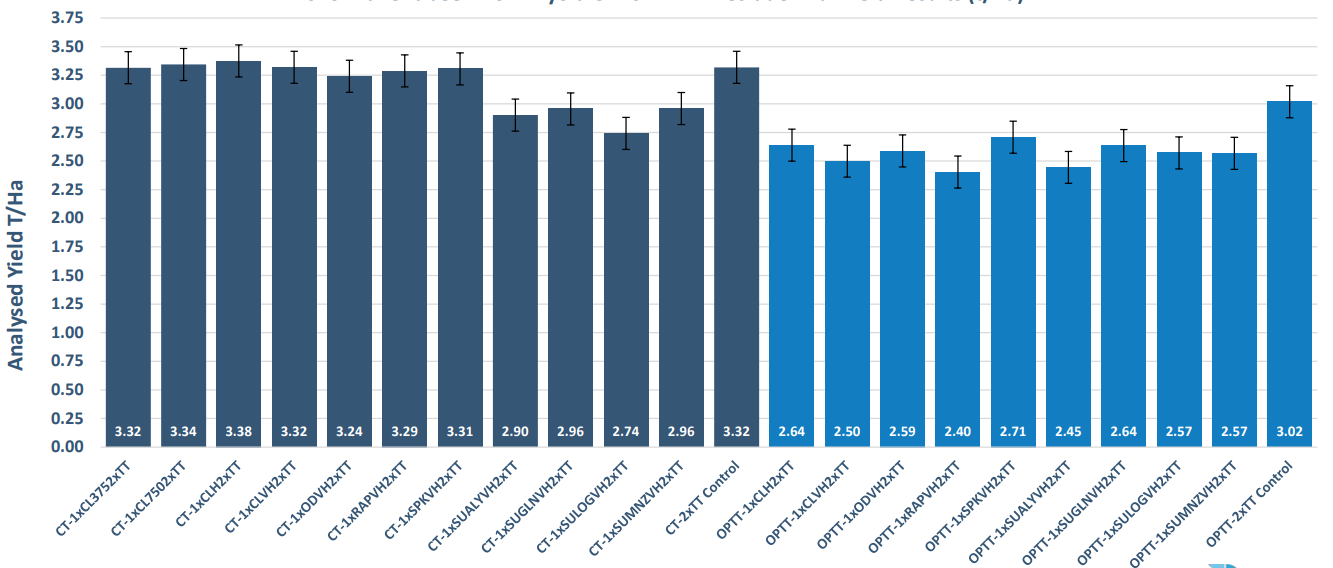
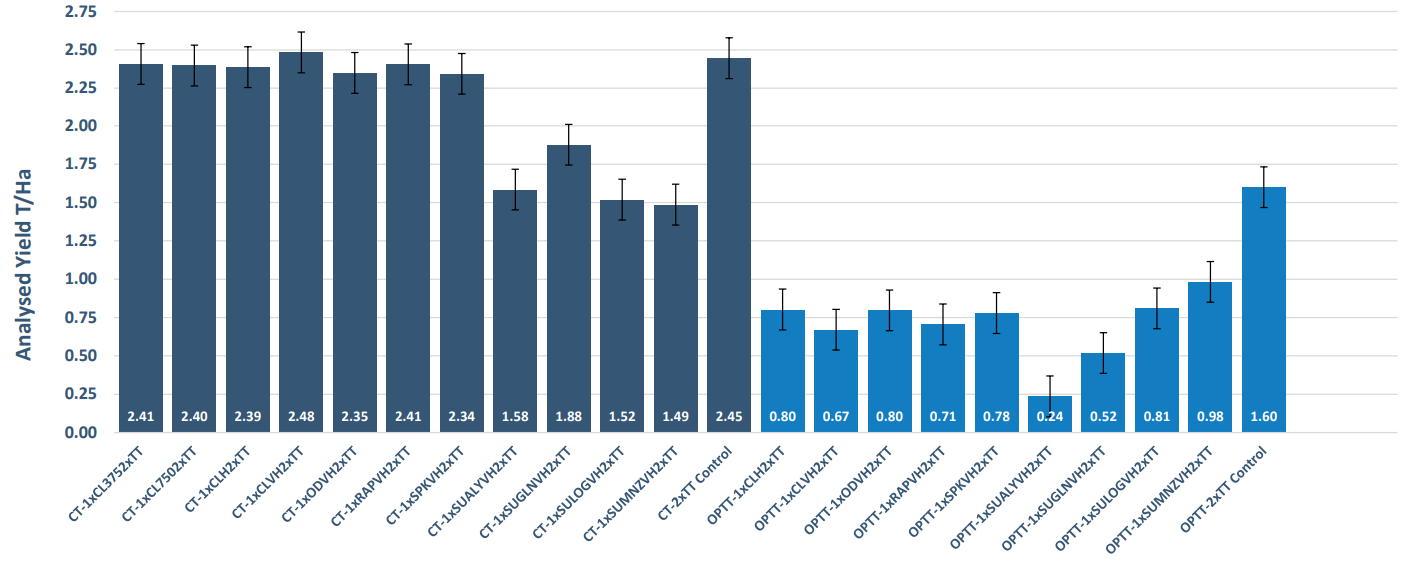
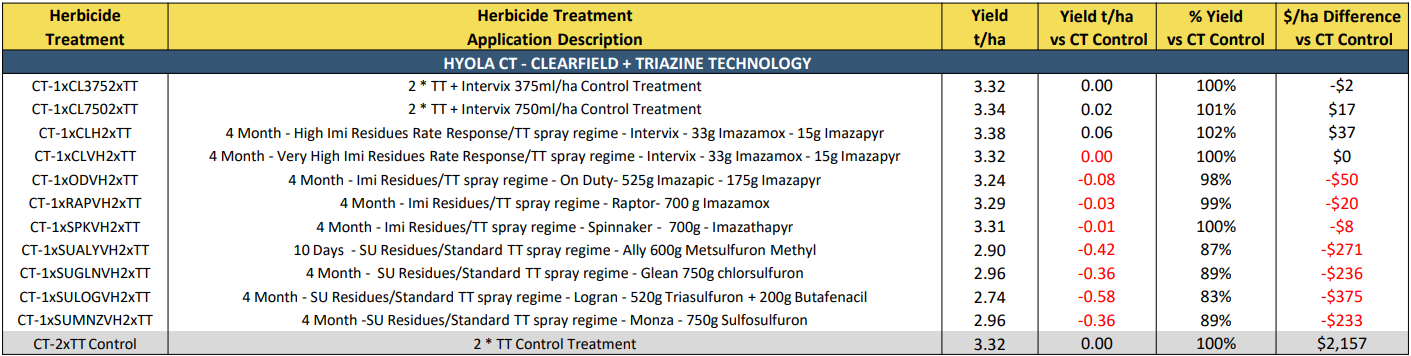
2020 Wallendbeen NSW – Hyola® CT IMI Residual Trial - Analysed Grain Yield Results
2020 Wallendbeen NSW Hyola CT vs TT IMI Residue Trial Yield Results (t/ha)
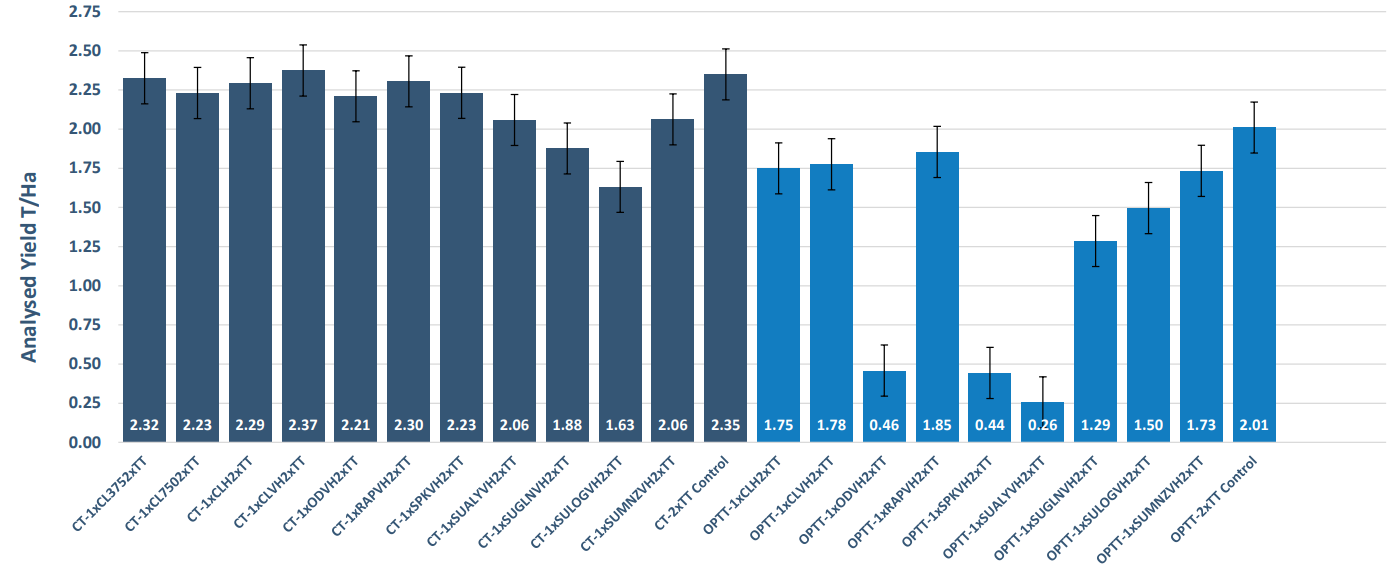
2020 Horsham Vic – Hyola® CT IMI Residual Trial - Analysed Grain Yield Results
2020 Horsham Vic - Hyola CT vs TT IMI Residue Trial Yield Results (t/ha)
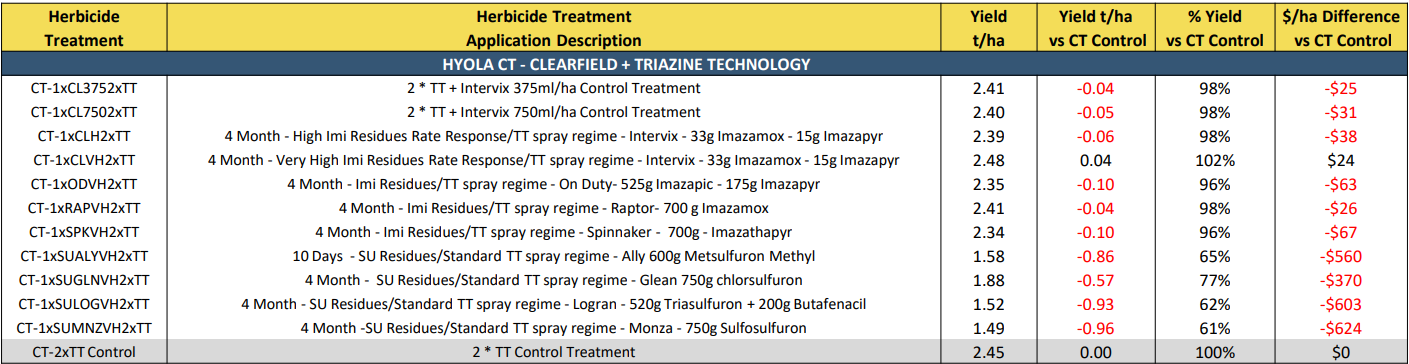
2020 Morbinning WA – Hyola® CT IMI Residual Trial - Analysed Grain Yield Results
2020 Morbinning WA - Hyola CT vs TT IMI Residue Trial Yield Results (t/ha)
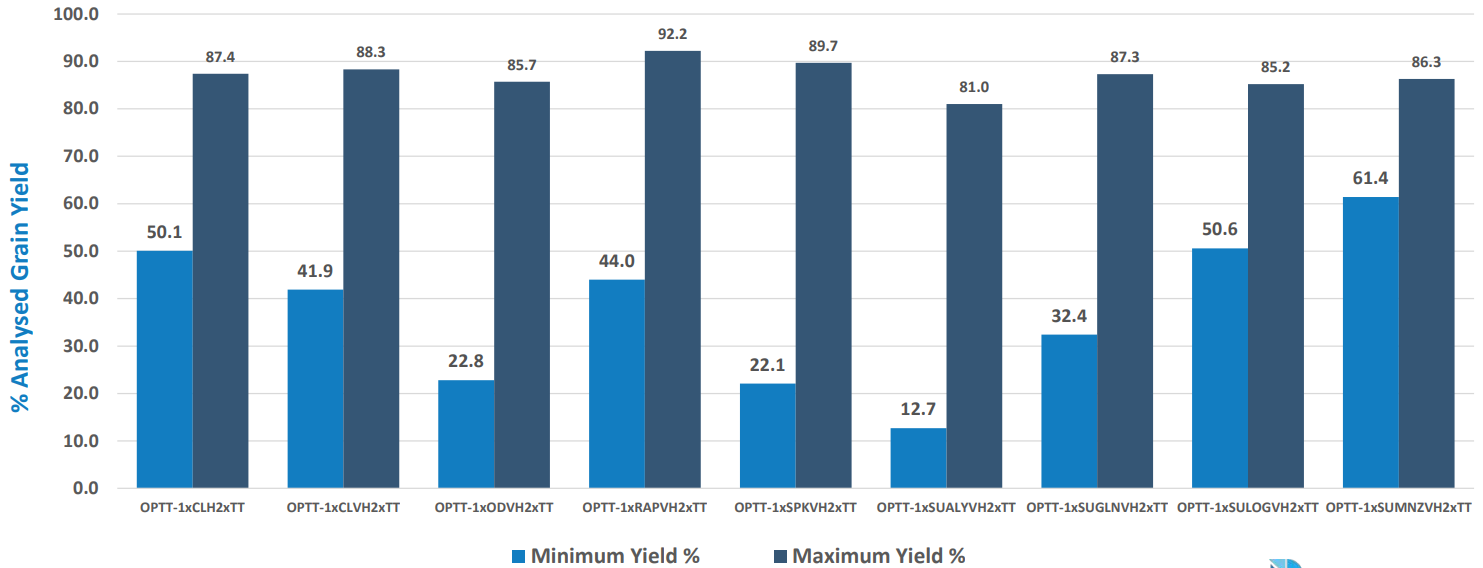
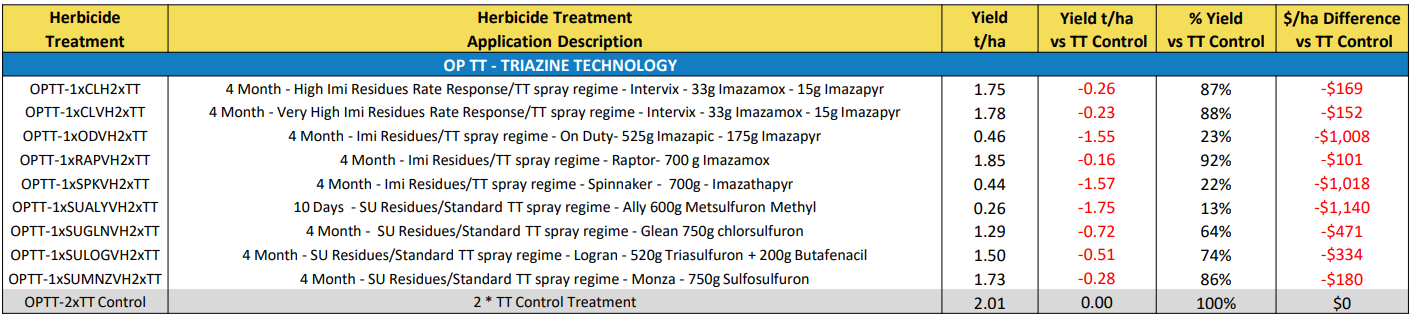
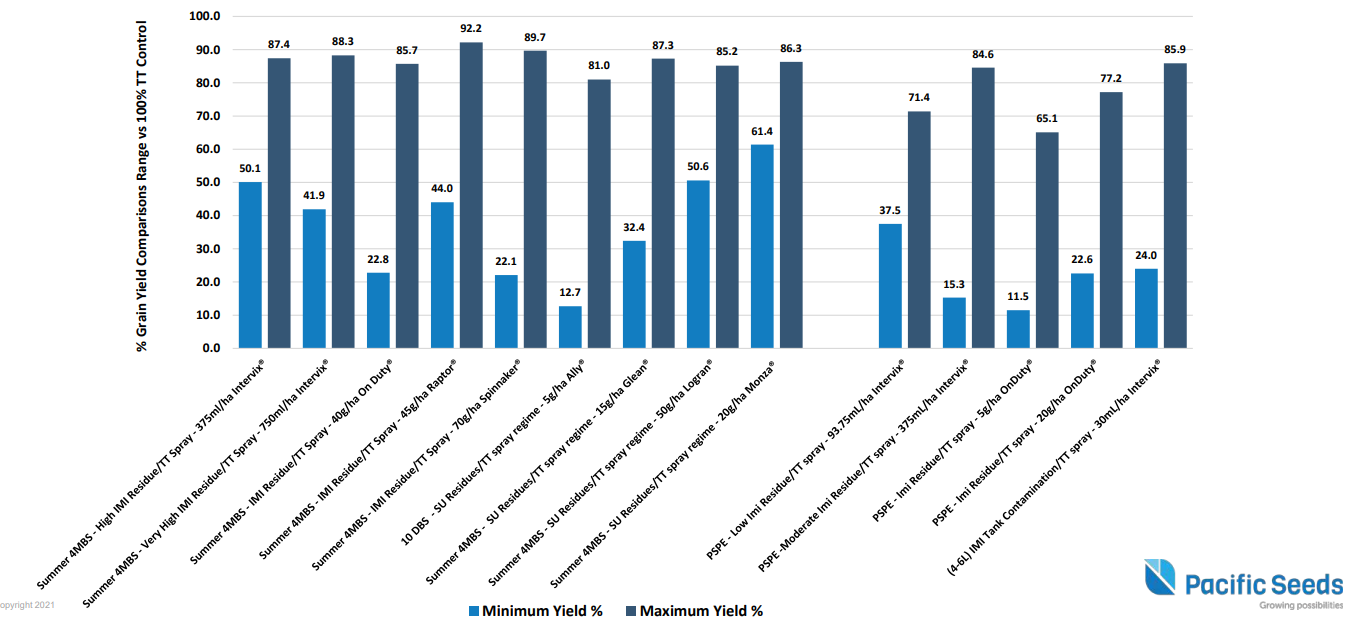
2020 Hyola® CT IMI Residue Trials – OP TT % Range of Grain Yield vs 100% TT Control
2020 TT Technology IMI & SU Carryover Treatment - % Grain Yield Comparisons Range vs 100% TT Control across 3 Trial locations
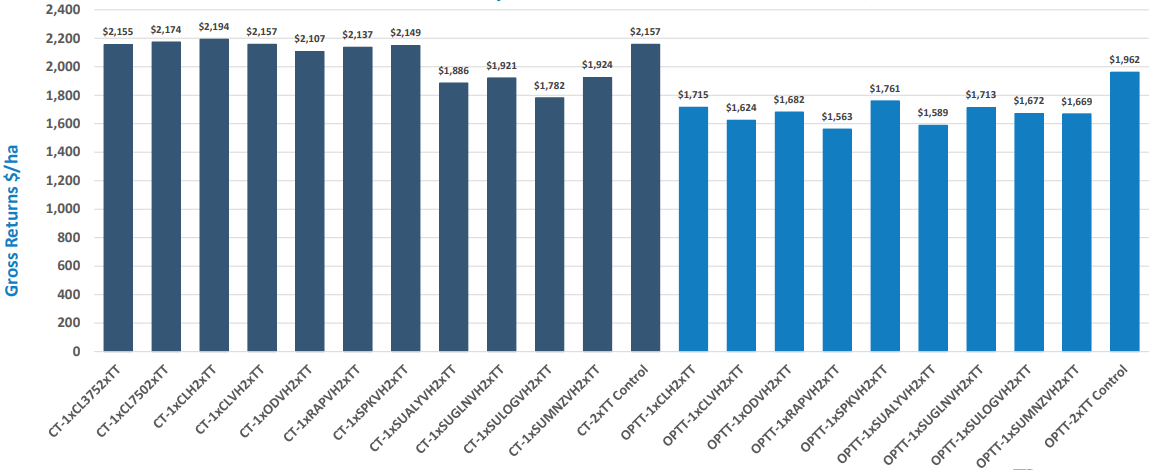
2020 Wallendbeen NSW – Hyola® CT IMI Residual Trial Gross Return $/ha Results
2020 Wallendbeen NSW - Hyola CT IMI Residue Trial Gross Returns $/ha
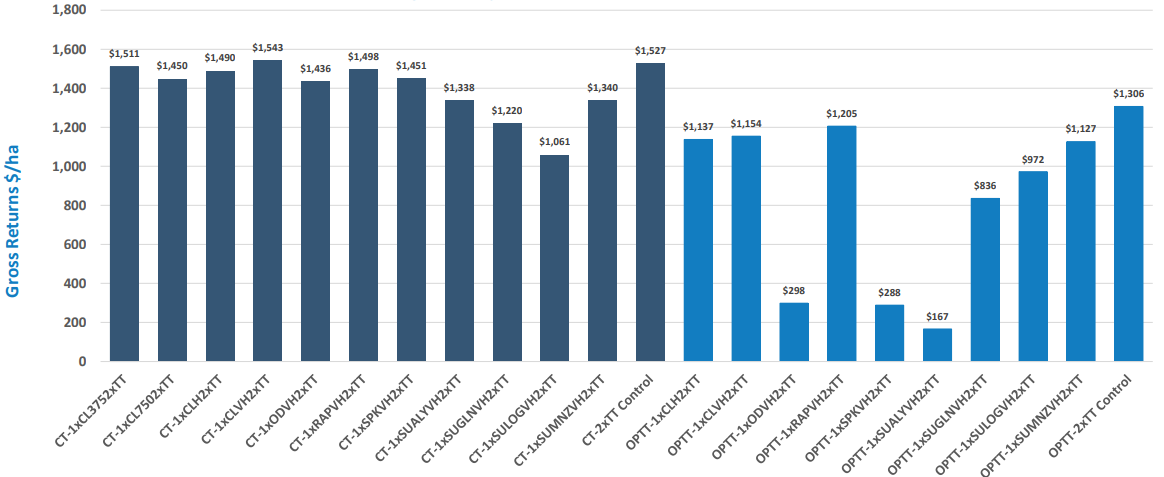
2020 Horsham Vic – Hyola® CT IMI Residual Trial Gross Return $/ha Results
2020 Horsham Vic - Hyola CT IMI Residue Trial Gross Returns $/ha
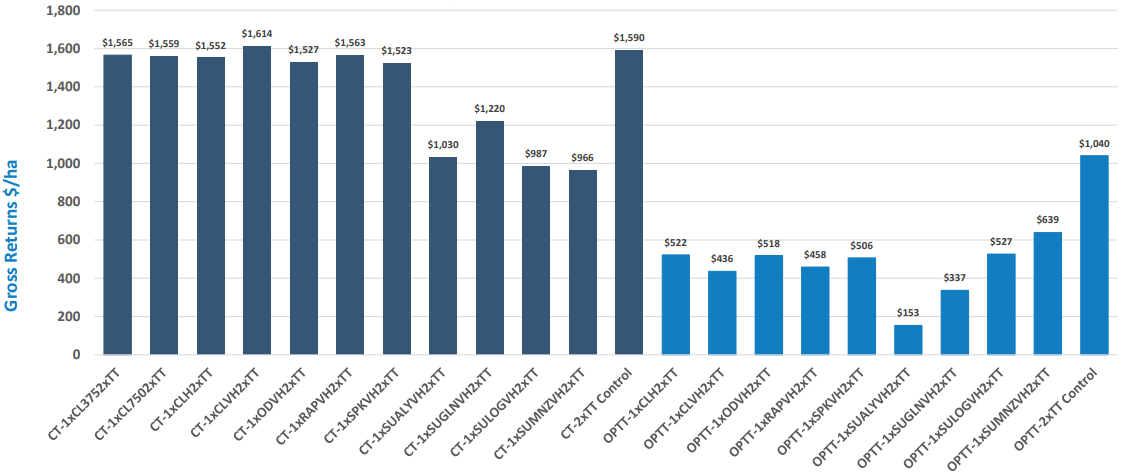
2020 Morbinning WA – Hyola® CT IMI Residual Trial Gross Return $/ha Results
2020 Morbinning WA - Hyola CT IMI Residue Trial Gross Returns $/ha
2020 Wallendbeen NSW – Hyola® CT IMI Residual Trial Overall Results Table

2020 Morbinning WA – Hyola® CT IMI Residual Trial Overall Results Table
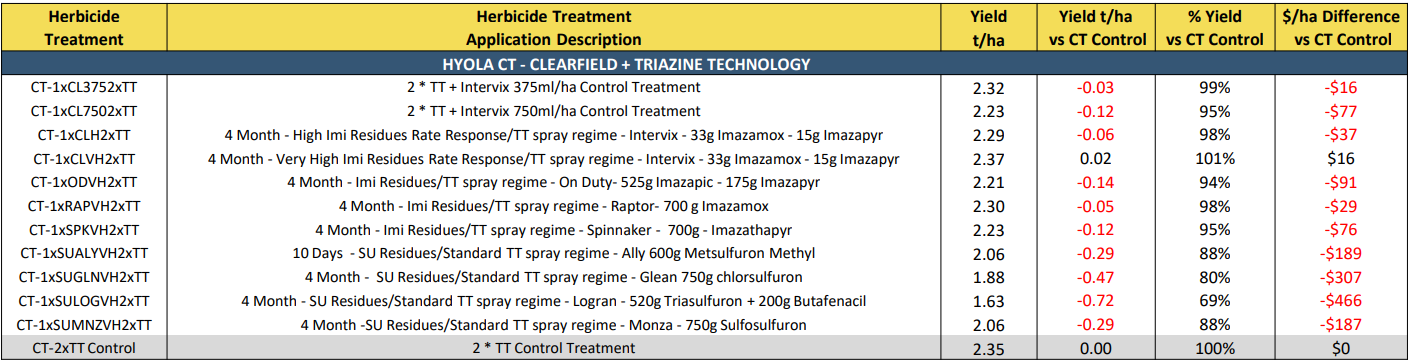
2020 Horsham Vic – Hyola® CT IMI Residual Trial Overall Results Table
2020 Summer Applications (3 Trials) vs 2019 PSPE Applications (5 Trials)
Triazine Technology IMI & SU Treatment Comparisons
The information provided in this publication is intended as a guide only. Advanta Seeds Pty Ltd (including its officers, employees, contractors and agents) (‘Advanta Seeds’) can not guarantee that every statement is without flaw of any kind. While Advanta Seeds has taken all due care to ensure that the information provided is accurate at the time of publication, various factors, including planting times and environmental conditions may alter the characteristics and performance from plants. Advanta Seeds shall not be liable for any errors or omissions in the information or for any loss, injury, damage or other consequence whatsoever that you or any person might incur as a result of your use of or reliance upon the products (whether Advanta Seeds products or otherwise) and information which appear in this publication. To the maximum extent permitted by law, the liability of Advanta Seeds for any claim whatsoever arising out of the supply or use of or reliance upon the products and information in this publication (including liability for breach of any condition or warranty implied by the Trade Practices Act 1974 or any other law) is limited at its discretion, to the replacement of the products, the supply of equivalent products or the resupply of the publication. For application to specific conditions, seek further advice from a local professional. © Advanta Seeds 2021.